Trip and route planning
Print the climb on a day hike or ski tour, count index lines to the summit and spot cliffs where the lines bunch together.
Make a topographic map of any place: elevation tints, bold labeled index lines and a street basemap, ready to print or share.
A .kml, .geojson or .json file with a Polygon or MultiPolygon, up to 5 MB. It is read in your browser and never uploaded. Samples: boulder-triangle.kml, test-parcel.geojson.
Every Nth contour is drawn bold (0 turns index lines off).
Terrain Tiles combine USGS 3DEP (about 10 m) in the US with SRTM and other 30 m data elsewhere, read on a 15 m grid (30 m above 100 km²).
Line colors follow elevation while Coloring is set to Elevation tints.
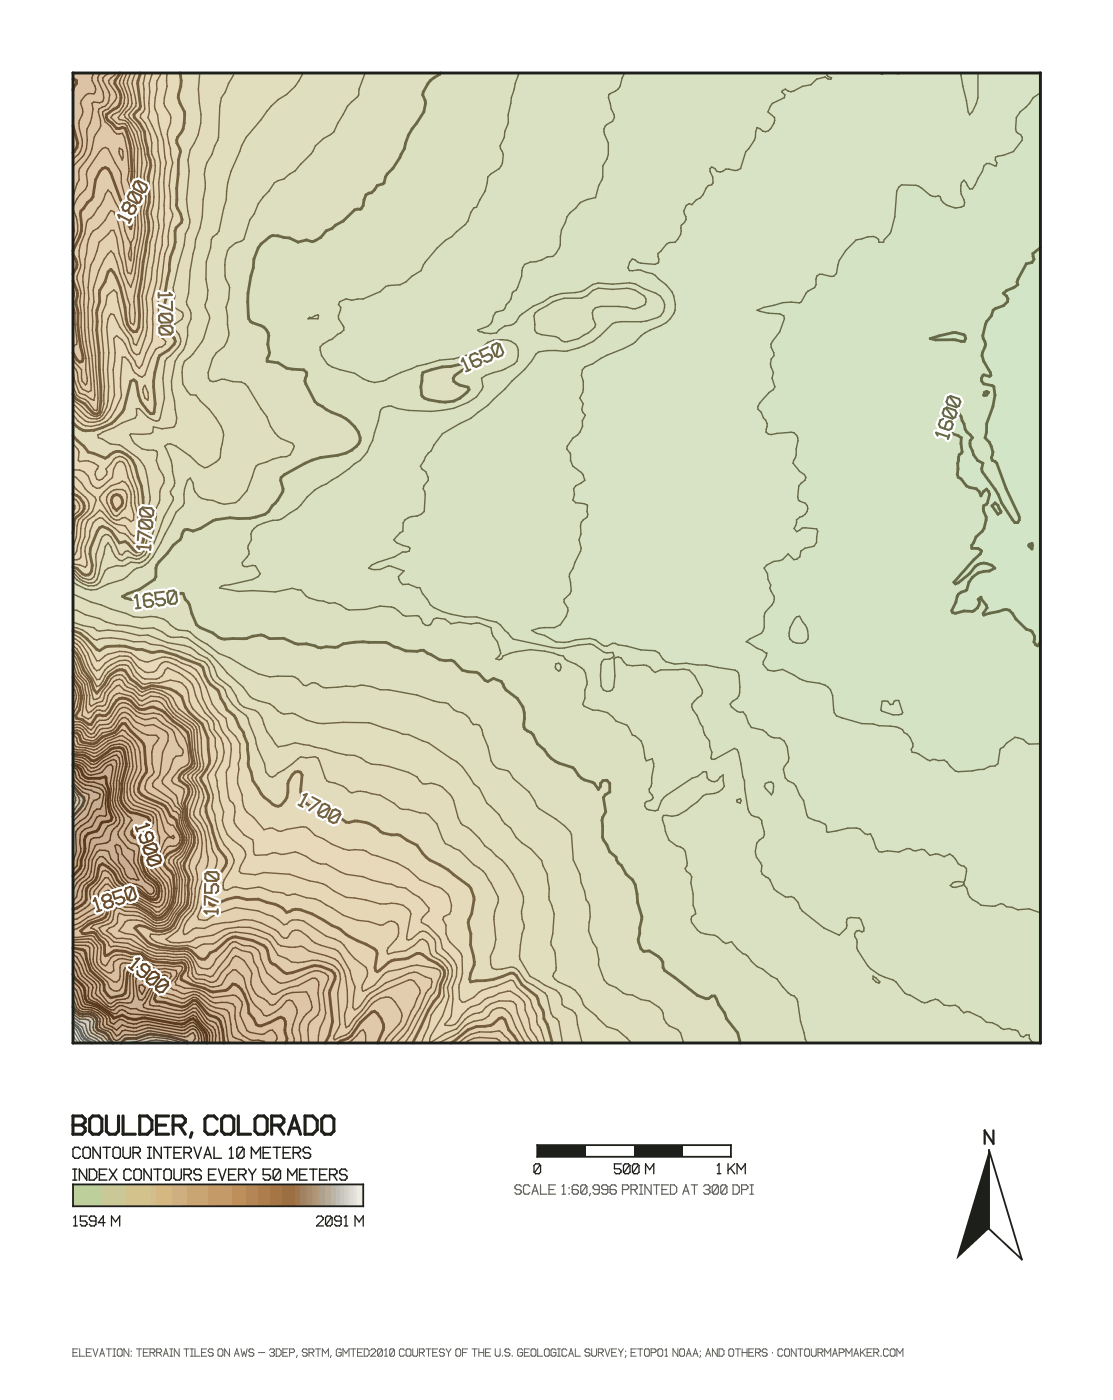
Contour interval 10 meters
Loading elevation for Boulder, CO…
Elevation: Terrain Tiles on AWS Open Data (USGS 3DEP, SRTM, GMTED2010 courtesy of the U.S. Geological Survey; ETOPO1 NOAA; and others) and, for Pro lidar, USGS 3DEP 1 m. Basemap, roads and place search © OpenStreetMap contributors (Nominatim). Full credits
Contours are generated from public elevation data. Accuracy depends on the source data, and they are not a substitute for a field survey or a licensed land survey.
The legend appears when the contours are ready.
Nothing saved yet. Saves stay in this browser only (localStorage).
Built on our server, in memory, from the contours on the map. Nothing is stored. Pricing
Layers appear when the contours are ready.
Groups appear when the contours are ready.
A folder per elevation, colored lines, labeled index lines and a legend overlay.
Zipped .shp, .shx, .dbf, .prj and .cpg with ELEV, UNIT and INDEX fields, in the coordinates chosen for DXF.
7357 × 8000 px
Add up to 20 areas, then download every chosen format for all of them in one zip, each area in its own folder in its local UTM zone.
Everything above the line stays free and unlimited. Pro adds CAD and print files, 1 m lidar for US sites, areas up to 2,000 km² and batches.
$9.99
One payment, every Pro feature for 7 days. No renewal.
$49 / year
Every Pro feature for a year. Renews yearly until you cancel.
Rendered by the same code as the tool above, from the free data, with the settings listed under each map. Open one to load it, then change the interval or colors.
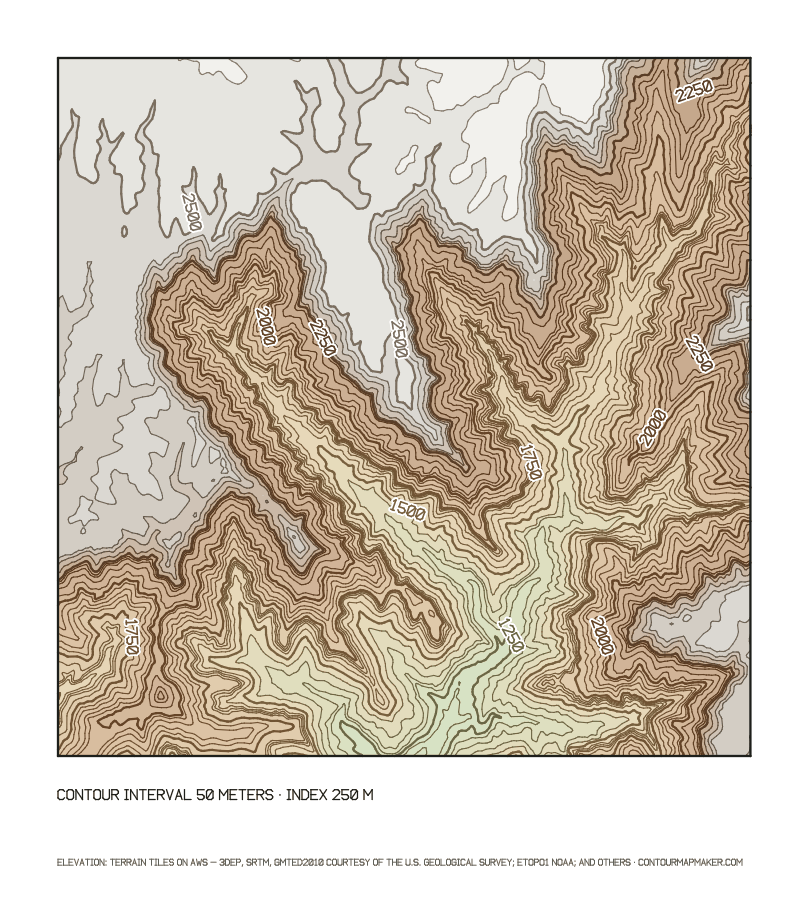
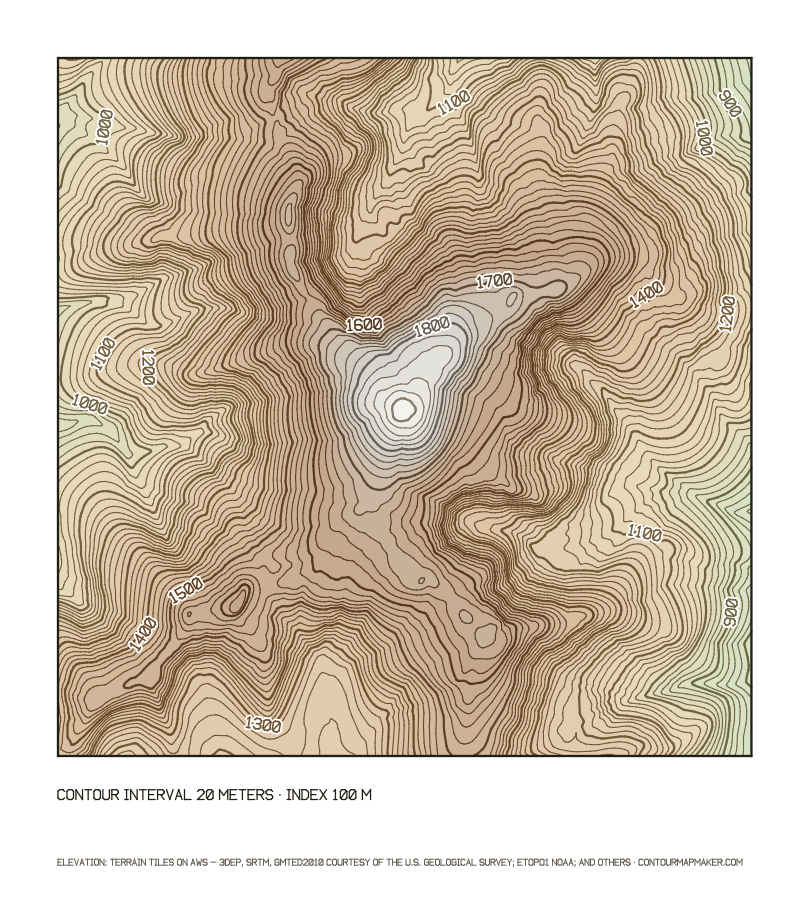
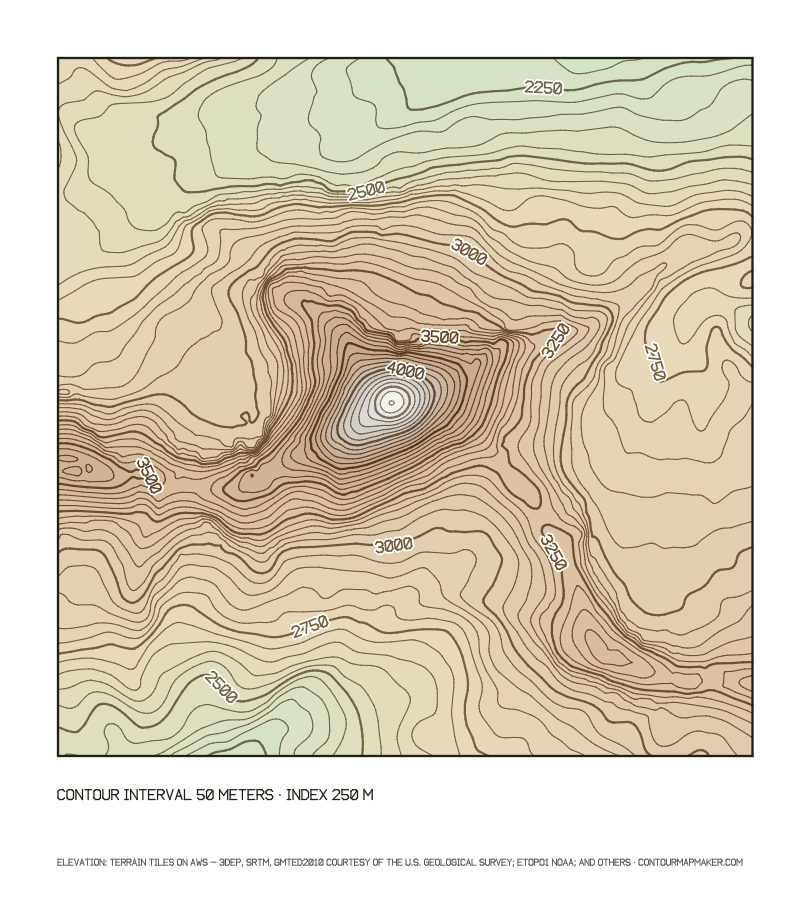
A topographic map is a contour map plus everything that makes the lines readable without a second source. The U.S. Geological Survey's 7.5-minute quadrangles set the pattern most people know: thin brown intermediate contours, thicker labeled index contours every fifth line, a contour interval printed in the margin, a scale bar and a north arrow. This topo map generator follows the same layout, and its Pro PNG puts these elements in a collar under the map the way a printed quad does.
| Element | What it tells you | In this tool |
|---|---|---|
| Intermediate contours | Every interval of elevation; spacing shows steepness | Interval, line color and width |
| Index contours | Bold lines with printed heights, usually every fifth line | Index line every, Label index lines |
| Elevation tints | Low ground green, then tan, brown, rock gray and white at the top, for a quick read of relief | Coloring: Elevation tints, with a legend |
| Contour interval statement | The vertical distance between lines | Under the map and in every PNG |
| Scale bar and north arrow | Distance on the ground and orientation | Under the live map; in the Pro PNG collar |
| Roads and buildings | Where you are, and what sits on the slope | OpenStreetMap basemap, Roads, Buildings |
Both names describe the same job. A terrain map generator usually means shaded relief, a picture of the land lit from one side. A topographic map maker draws measured lines you can read numbers from: the elevation of a trailhead, how far a ridge climbs, whether a slope is 10% or 40%. Contours are what survive a black-and-white print, a laser cutter or a CAD drawing, which is why this topographic map creator draws lines first and adds tints as an option.
Lines close together mean steep ground, lines far apart mean gentle ground. With a 10 m interval, contours 100 m apart on the map describe a 10% grade, and contours 20 m apart a 50% grade. The elevation contour map guide has a full spacing-to-slope table, and the land contour map guide explains what each slope class means for building and farming.
Print the climb on a day hike or ski tour, count index lines to the summit and spot cliffs where the lines bunch together.
Teachers use local hills and famous peaks to show how contours become ridges, valleys and saddles, then compare the tints with the lines.
A tinted topographic map of a home valley, a summit you climbed or a national park, printed from the 8000 px PNG.
Ecologists, foresters and geologists add a quick topographic base map with a scale bar to a site report.
On a topographic map the interval decides how much detail fits. Aim for 25 to 50 levels: the Grand Canyon example spans about 1,450 m at 50 m (29 levels) and Mount Washington about 1,140 m at 20 m (56 levels). Find your area and relief below.
| Area you select | Terrain | Relief | Interval, m | Interval, ft | Data that supports it |
|---|---|---|---|---|---|
| House lot or building site, under 0.1 km² (25 acres) | Gentle to hillside | 5–25 m | 0.5 | 1–2 | 3DEP 1 m lidar (Pro, US) for survey-grade lines; free data shows the shape |
| Small farm or acreage, 0.1–2 km² | Rolling | 20–100 m | 0.5–2 | 2–10 | 3DEP 1 m lidar (Pro, US) for survey-grade lines; free data shows the shape |
| Farm, ranch or park, 2–10 km² | Hilly | 100–300 m | 2–10 | 10–20 | 3DEP 1 m lidar (Pro, US) for survey-grade lines; free data shows the shape |
| Town or valley, 10–50 km² | Hills to foothills | 300–800 m | 10–20 | 20–80 | Free data in the US; elsewhere use 20 m or more |
| Mountain area, 50–100 km² (free limit) | Mountains | 800–2,000 m | 20–50 | 80–200 | Free data, worldwide |
| Range or region, 100–2,000 km² (Pro) | High mountains | 1,500–4,000 m | 50–100 | 100–500 | Free data, worldwide |
Relief is the highest minus the lowest elevation in your selection (the tool shows both under Map data). Interval = relief ÷ 50, rounded up to 0.5, 1, 2, 5, 10, 20, 25, 50, 100 or 200 m (1, 2, 5, 10, 20, 40, 50, 80, 100, 200, 250 or 500 ft). The last column applies the 1947 National Map Accuracy Standard, interval ≥ 3.29 × the data's vertical RMSE: about 0.3 m for lidar, 5.1 m for the US 10 m data and 18 m for SRTM.
A contour map shows only the lines of equal elevation. A topographic map adds what you need to read them in context: labeled index lines, elevation tints, roads and buildings, a scale bar, a north arrow and a legend with the contour interval. This generator draws both; switch Coloring to Elevation tints and the basemap to OpenStreetMap for the full topo look.
Index contours are every fifth line (or every Nth line you choose), drawn twice as thick and labeled with their elevation. With a 20 m interval the index lines fall at 100 m steps, so you can read heights at a glance and count the thin intermediate lines between them.
The number on a bold line is the elevation of that whole line. To find the height of a point, start at the nearest labeled line and count the thin lines toward your point, adding or subtracting one interval for each. Closed loops with rising numbers are hills; loops with falling numbers are hollows.
The Pro 8000 px PNG adds a collar under the map with the title, contour interval, legend, a scale bar labeled 1:N at 300 dpi and a north arrow. The free 4096 px PNG carries the interval statement and data credit. On screen, the scale bar sits under the live map.
At 300 dpi the free 4096 px PNG prints about 34.7 cm (13.7 in) on its long side, and the Pro 8000 px PNG about 67.7 cm (26.7 in). For a larger poster, export the SVG, which scales to any size without losing sharpness.
Yes. The free data covers the whole planet, from SRTM and national models such as EU-DEM, so a topographic map of the Alps, Japan or the Andes works the same way. The Matterhorn example on this page uses that global coverage. USGS 3DEP 1 m lidar is US only.
Gridded elevation data averages each cell, so a sharp summit narrower than a cell reads low. The Matterhorn is 4,478 m, but the 30 m data peaks at 4,354 m. Rounded hills and plateaus come out close to their surveyed heights; needles and pinnacles do not.