Site plans and CAD bases
Architects, landscape architects and engineers sketch on public contours before the topographic survey is ordered, then trade the base for survey data. The DXF keeps one layer per elevation with Z values.
A free contour map maker for any area: search a place or draw a box, pick an interval and download contour lines. No sign-up.
A .kml, .geojson or .json file with a Polygon or MultiPolygon, up to 5 MB. It is read in your browser and never uploaded. Samples: boulder-triangle.kml, test-parcel.geojson.
Every Nth contour is drawn bold (0 turns index lines off).
Terrain Tiles combine USGS 3DEP (about 10 m) in the US with SRTM and other 30 m data elsewhere, read on a 15 m grid (30 m above 100 km²).
Line colors follow elevation while Coloring is set to Elevation tints.
Contour interval 10 meters
Loading elevation for Boulder, CO…
Elevation: Terrain Tiles on AWS Open Data (USGS 3DEP, SRTM, GMTED2010 courtesy of the U.S. Geological Survey; ETOPO1 NOAA; and others) and, for Pro lidar, USGS 3DEP 1 m. Basemap, roads and place search © OpenStreetMap contributors (Nominatim). Full credits
Contours are generated from public elevation data. Accuracy depends on the source data, and they are not a substitute for a field survey or a licensed land survey.
The legend appears when the contours are ready.
Nothing saved yet. Saves stay in this browser only (localStorage).
Built on our server, in memory, from the contours on the map. Nothing is stored. Pricing
Layers appear when the contours are ready.
Groups appear when the contours are ready.
A folder per elevation, colored lines, labeled index lines and a legend overlay.
Zipped .shp, .shx, .dbf, .prj and .cpg with ELEV, UNIT and INDEX fields, in the coordinates chosen for DXF.
7357 × 8000 px
Add up to 20 areas, then download every chosen format for all of them in one zip, each area in its own folder in its local UTM zone.
Everything above the line stays free and unlimited. Pro adds CAD and print files, 1 m lidar for US sites, areas up to 2,000 km² and batches.
$9.99
One payment, every Pro feature for 7 days. No renewal.
$49 / year
Every Pro feature for a year. Renews yearly until you cancel.
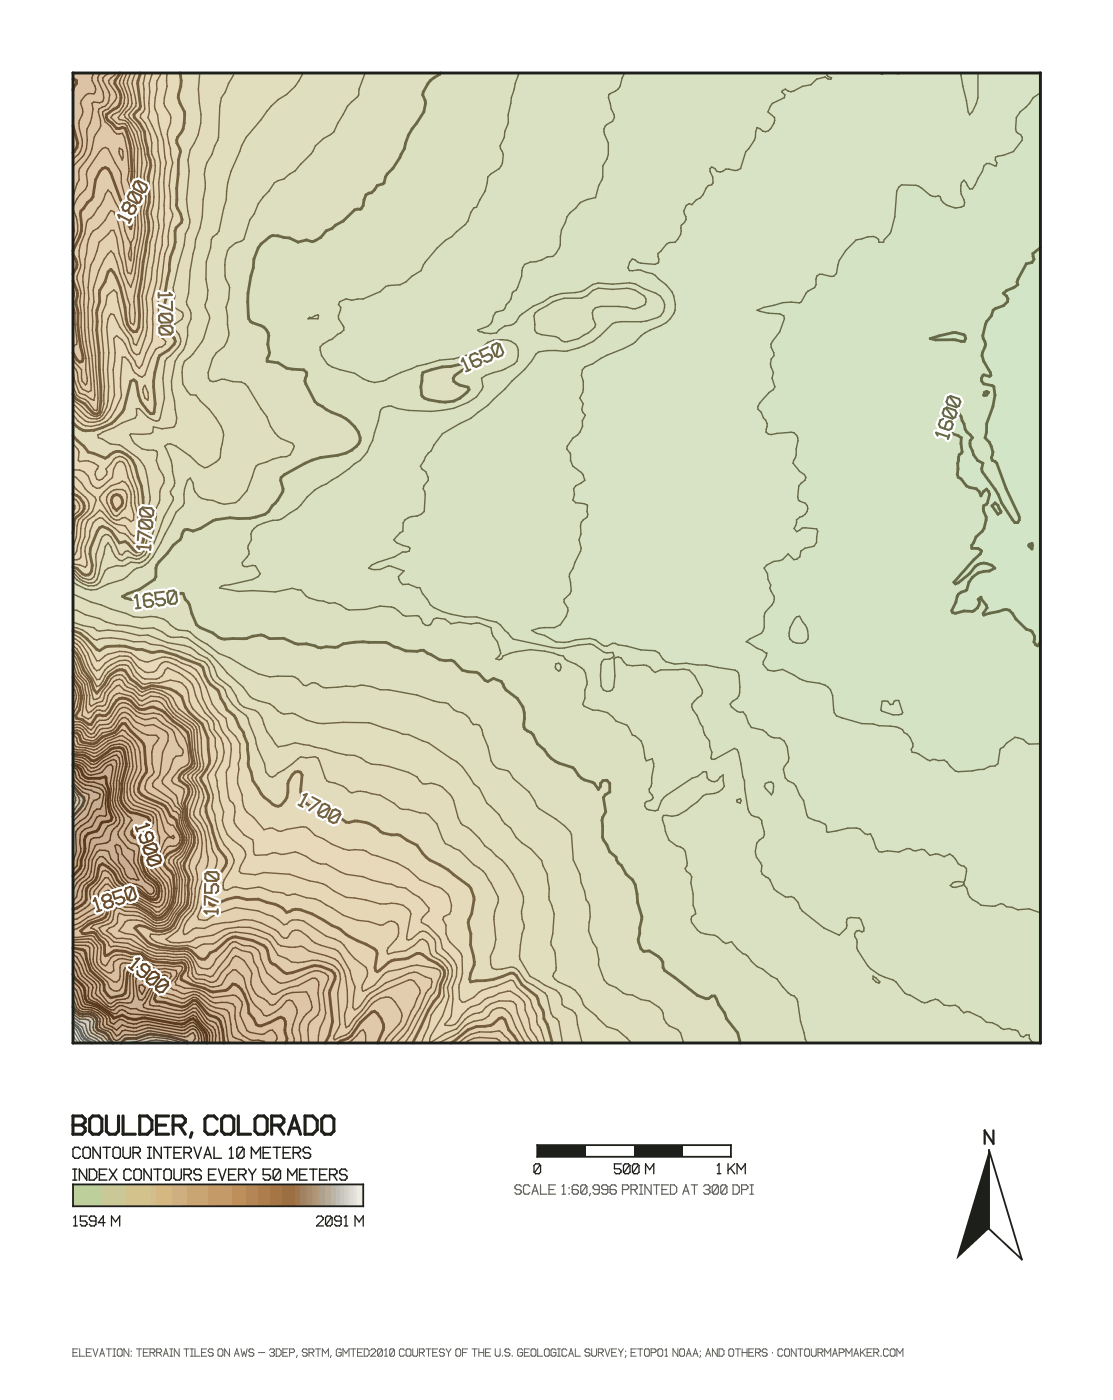
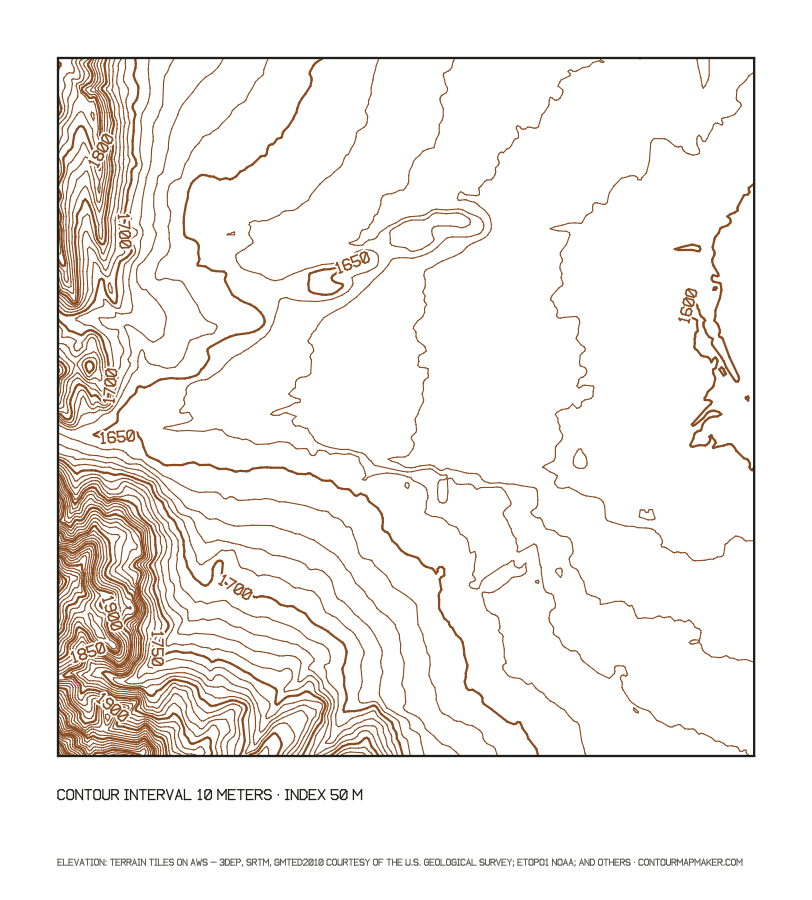
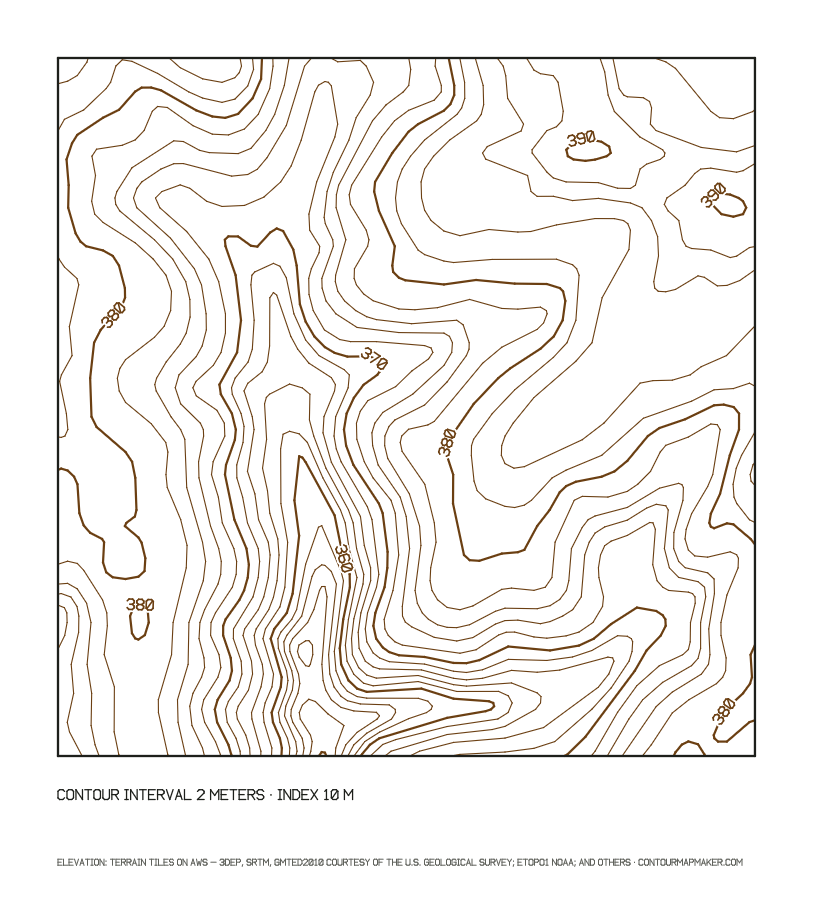
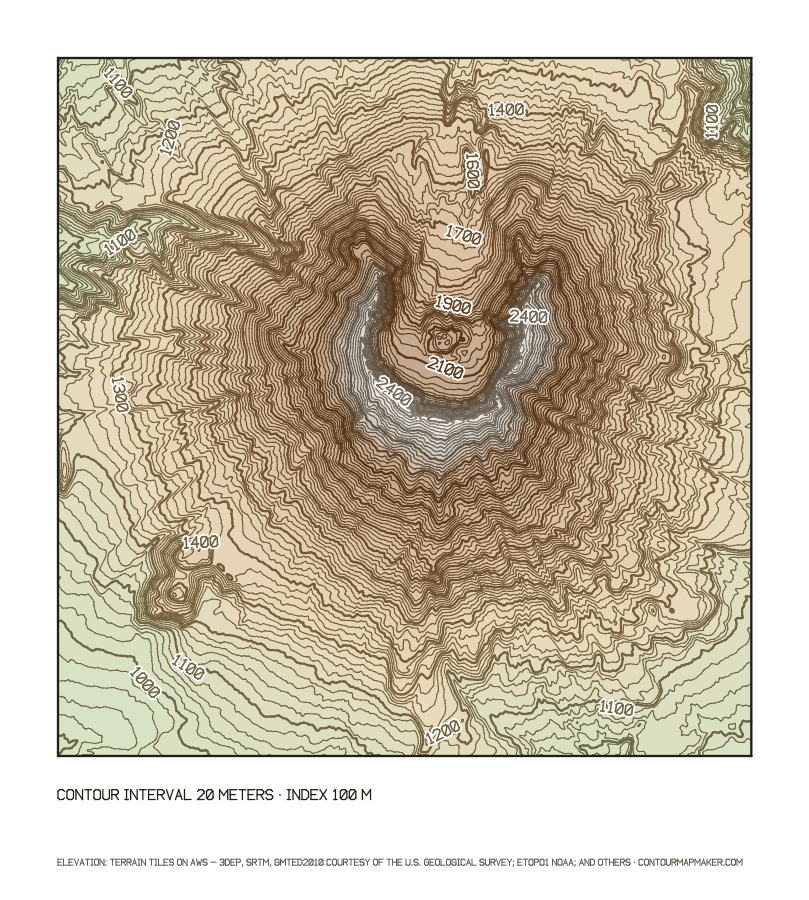
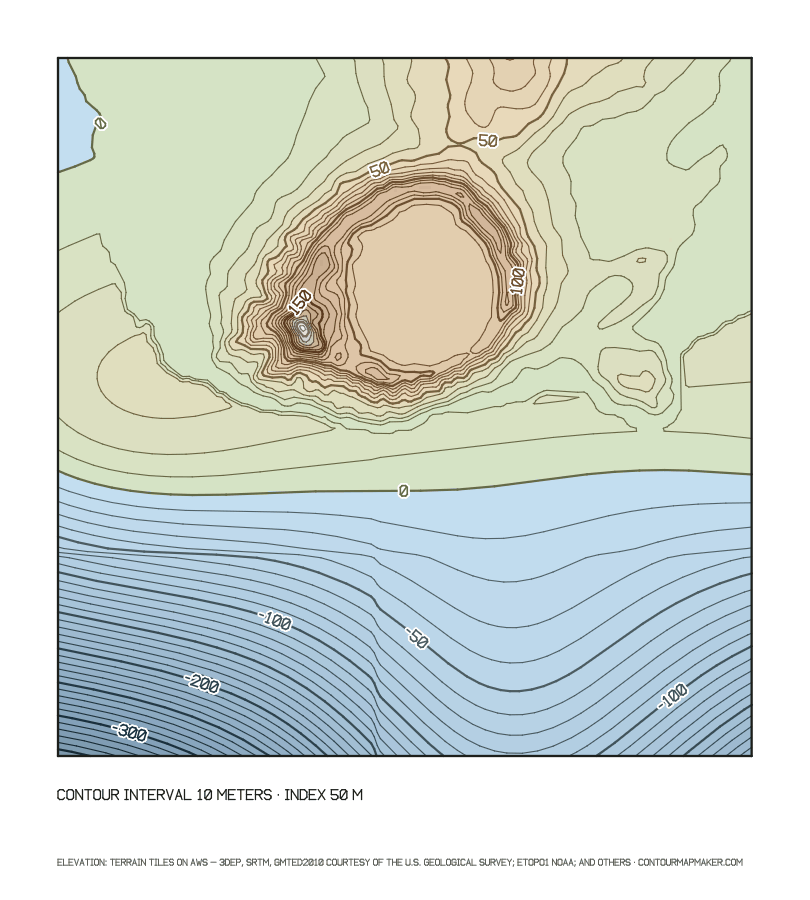
Four maps this contour map creator drew from the same free data and code as the tool above, at their real settings. Open one to load the same area and interval, then change anything.
The contour lines generator works on a laptop or a phone. On a phone, tap Rectangle or Polygon and draw with your finger.
Architects, landscape architects and engineers sketch on public contours before the topographic survey is ordered, then trade the base for survey data. The DXF keeps one layer per elevation with Z values.
Find ridges, valleys, ponds and drainage on a property, and lay out swales and keylines along the contour. See the land contour map guide for slope classes.
Turn a favorite mountain, lake or city into a print or a stacked wood relief. SVG exports are real vectors with one path per line.
Print a 4096 px map of a route, or use contour maps of familiar places to teach how lines turn into hills, valleys and saddles.
Load the GeoJSON into QGIS, ArcGIS, Mapbox or Leaflet. Each feature has elevation, unit and index attributes in WGS84.
This contour map software never makes up terrain. It downloads public elevation tiles for your area, decodes each pixel into a height and traces lines where the surface crosses each contour level. The free data is Terrain Tiles from the Registry of Open Data on AWS: USGS 3DEP at about 10 m in the United States, SRTM and GMTED2010 elsewhere, ETOPO1 under the sea, and national models in Europe, Australia, New Zealand and other countries. Pro adds the USGS 3D Elevation Program 1 m lidar for US sites.
Each tile stores height in its red, green and blue channels. Following the Tilezen terrarium format, elevation = R × 256 + G + B ÷ 256 − 32768 meters. The tool contours the grid with marching squares and linear interpolation (the method behind d3-contour) in a Web Worker in your browser, smooths it lightly, and clips the lines to your rectangle or boundary. Changing the interval, index lines or colors reuses the grid in memory and does not download tiles again.
| Source | Cell size | Vertical RMSE | Finest NMAS interval | Reference |
|---|---|---|---|---|
| USGS 3DEP lidar, quality level 2 | 1 m | 10 cm | 0.33 m | USGS Lidar Base Specification: RMSEz ≤ 10 cm in open terrain |
| USGS 3DEP 1/3 arc-second (US part of Terrain Tiles) | about 10 m | 1.55 m | 5.1 m | Gesch, Oimoen and Evans (2014), USGS Scientific Investigations Report 2014-5008 |
| SRTM (most land outside the US in Terrain Tiles) | about 30 m | 5.5 m | 18.1 m | Rodríguez et al. (2006): 90% absolute error 5.6–9.0 m by continent, 9.0 m ÷ 1.6449 shown |
Contours are generated from public elevation data. Accuracy depends on the source data, and they are not a substitute for a field survey or a licensed land survey.
Property lines, setbacks, flood zones and permits need a licensed surveyor or engineer. Use these contours to understand a place and plan, not to stake or build.
Credits: elevation from Terrain Tiles (USGS 3DEP, SRTM and GMTED2010 courtesy of the U.S. Geological Survey; ETOPO1 from NOAA; and the other providers listed in the full data credits), lidar from USGS 3DEP, basemap and roads © OpenStreetMap contributors, and place search by Nominatim. The same credit is written into every PNG, GeoJSON, SVG, KML, KMZ and DXF, and Shapefile zips carry an attribution.txt. For how the data and intervals work, read the elevation contour map guide; for property and farm use, the land contour map guide.
The free contour map maker is not a trial: no account, no watermark, no daily cap. Pro adds the formats CAD, GIS and print shops ask for, plus lidar and larger areas.
| Feature | Free | Pro (7-day pass $9.99 or yearly $49) |
|---|---|---|
| Area per map | Up to 100 km² | Up to 2,000 km², fetched in chunks |
| Elevation data | Terrain Tiles worldwide (about 10 m in the US, 30 m elsewhere) | Plus USGS 3DEP 1 m lidar in the US (1 m up to 10 km², coarser 3DEP above that, labeled) |
| Area selection | Search, coordinates, rectangle, polygon, KML or GeoJSON boundary | Same |
| Contours and style | Any interval in m or ft, index lines and labels, colors, elevation tints, basemap, roads, buildings, sea floor | Same |
| PNG | 4096 px, no watermark | 8000 px sheet with scale bar, legend and north arrow |
| GeoJSON, basic SVG, basic KML | Yes | Yes |
| DXF for CAD | No | Layer per elevation, Z values, WGS84, UTM or State Plane, m or ft |
| Layered SVG | No | One group per elevation, labeled index lines, sized in mm |
| KMZ and Shapefile | No | Elevation folders and legend; zipped .shp with .prj |
| Batch | No | Up to 20 areas × formats in one zip |
| Share links and saves in this browser | Yes | Yes |
Aim for 25 to 50 contour levels across your area: fewer and the shape of the land disappears, more and the lines merge on screen and on paper. Find your area and relief below, then check the free data can carry that interval.
| Area you select | Terrain | Relief | Interval, m | Interval, ft | Data that supports it |
|---|---|---|---|---|---|
| House lot or building site, under 0.1 km² (25 acres) | Gentle to hillside | 5–25 m | 0.5 | 1–2 | 3DEP 1 m lidar (Pro, US) for survey-grade lines; free data shows the shape |
| Small farm or acreage, 0.1–2 km² | Rolling | 20–100 m | 0.5–2 | 2–10 | 3DEP 1 m lidar (Pro, US) for survey-grade lines; free data shows the shape |
| Farm, ranch or park, 2–10 km² | Hilly | 100–300 m | 2–10 | 10–20 | 3DEP 1 m lidar (Pro, US) for survey-grade lines; free data shows the shape |
| Town or valley, 10–50 km² | Hills to foothills | 300–800 m | 10–20 | 20–80 | Free data in the US; elsewhere use 20 m or more |
| Mountain area, 50–100 km² (free limit) | Mountains | 800–2,000 m | 20–50 | 80–200 | Free data, worldwide |
| Range or region, 100–2,000 km² (Pro) | High mountains | 1,500–4,000 m | 50–100 | 100–500 | Free data, worldwide |
Relief is the highest minus the lowest elevation in your selection (the tool shows both under Map data). Interval = relief ÷ 50, rounded up to 0.5, 1, 2, 5, 10, 20, 25, 50, 100 or 200 m (1, 2, 5, 10, 20, 40, 50, 80, 100, 200, 250 or 500 ft). The last column applies the 1947 National Map Accuracy Standard, interval ≥ 3.29 × the data's vertical RMSE: about 0.3 m for lidar, 5.1 m for the US 10 m data and 18 m for SRTM.
Divide the relief of your area (the highest minus the lowest elevation, shown under Map data) by about 50 and round up to a standard value. The Boulder sample rises about 500 m in 5 × 5 km, so 10 m gives 50 levels. Farmland with 40 m of relief reads well at 1 or 2 m, and a 9 km mountain view with 1,600 m of relief at 50 m. The interval table on this page lists suggestions by area and terrain in meters and feet.
They are as accurate as the elevation data under them. In the United States the free data is USGS 3DEP at about 10 m, with a published vertical error of about 1.55 m RMSE. Most other land uses SRTM at about 30 m, where 90% of heights are within about 6 to 9 m. Pro lidar in the US is about 10 cm. Contours are generated from public elevation data. Accuracy depends on the source data, and they are not a substitute for a field survey or a licensed land survey.
Yes. The files you download are yours to use in client work, products and publications. The elevation sources are public domain (USGS) or open licenses that ask for attribution, so keep the credit line every file carries. If you add OpenStreetMap roads or buildings to a PNG, keep the © OpenStreetMap contributors credit as well.
Open the .dxf with OPEN (set the file type to DXF) or bring it into an existing drawing with INSERT. Each elevation is its own layer named CONTOUR_ followed by the elevation, for example CONTOUR_1600, and every polyline carries its elevation as Z, so you can freeze layers, filter by height or build a Civil 3D surface from the contours. Pick UTM or State Plane before downloading if you want projected coordinates, because AutoCAD does not reproject on import.
With Google Earth Pro installed, double-click the file or use File, Open. In Google Earth on the web, open Projects, choose New project and then Import KML file from computer. The free KML puts every line in one folder; the Pro KMZ adds a folder per elevation, colors, labeled index lines and a legend. Lines are clamped to the ground so they follow Google Earth terrain.
Yes. With Include sea-floor contours checked, which is the default, elevations below 0 get contours too. Depths come from the bathymetry inside Terrain Tiles (mainly ETOPO1), which is far coarser than the land data, so treat them as a sketch of the sea floor and never as a nautical chart. The Diamond Head example shows the slope south of Oahu down to about 358 m below sea level.
Up to 100 km² for free, for example a 10 × 10 km square, and up to 2,000 km² with Pro. Large areas are fetched and computed in chunks with a progress bar. One map can hold at most 500 contour levels; if your interval would make more, the tool asks for a larger one.
From Terrain Tiles, the open Mapzen and Tilezen terrain dataset on the Registry of Open Data on AWS. It merges USGS 3DEP in the US, SRTM and GMTED2010 worldwide, ETOPO1 for the oceans and national models such as EU-DEM, Geoscience Australia and LINZ. Pro lidar comes from the USGS 3D Elevation Program 1 m data. No paid or account-based elevation service is used.
No. The free tool needs no account, no email and no cookie, and there is no limit on maps or downloads. Pro is a 7-day pass or a yearly plan, and there is still no account to create. While checkout is being set up, the Pro files are free to use as well.
Yes. On a phone the map and the area controls come first, you can draw a rectangle or a polygon with your finger, and downloads go to your files. Tap Rectangle, then press and drag on the map; for a polygon, tap each corner and then Finish shape.
A PNG up to 4096 px on the long side with no watermark, GeoJSON lines with elevation, unit and index attributes in WGS84, a basic SVG with one path per line, and a basic KML for Google Earth. Every file carries the data credit and the contour interval.
When the land changes less than the data can resolve, a small interval traces data noise instead of terrain and draws small loops. The tool smooths the grid before contouring, but if lines still wander, raise the interval, or for a US site switch the elevation data to USGS 3DEP 1 m lidar.
Copy share link puts the area and every setting in the link itself, after the # sign, so nothing is sent to us. Save in this browser keeps a list of your areas in local storage on this device; clearing the site data removes it.