Architects and designers
A 3D site base for massing studies and early design in SketchUp, Revit or Rhino before a survey is ordered.
Turn any area into DXF contour lines with real elevations, one layer per height, in UTM or State Plane coordinates.
A .kml, .geojson or .json file with a Polygon or MultiPolygon, up to 5 MB. It is read in your browser and never uploaded. Samples: boulder-triangle.kml, test-parcel.geojson.
Every Nth contour is drawn bold (0 turns index lines off).
Terrain Tiles combine USGS 3DEP (about 10 m) in the US with SRTM and other 30 m data elsewhere, read on a 15 m grid (30 m above 100 km²).
Line colors follow elevation while Coloring is set to Elevation tints.
Contour interval 10 meters
Loading elevation for Boulder, CO…
Elevation: Terrain Tiles on AWS Open Data (USGS 3DEP, SRTM, GMTED2010 courtesy of the U.S. Geological Survey; ETOPO1 NOAA; and others) and, for Pro lidar, USGS 3DEP 1 m. Basemap, roads and place search © OpenStreetMap contributors (Nominatim). Full credits
Contours are generated from public elevation data. Accuracy depends on the source data, and they are not a substitute for a field survey or a licensed land survey.
The legend appears when the contours are ready.
Nothing saved yet. Saves stay in this browser only (localStorage).
Built on our server, in memory, from the contours on the map. Nothing is stored. Pricing
Layers appear when the contours are ready.
Groups appear when the contours are ready.
A folder per elevation, colored lines, labeled index lines and a legend overlay.
Zipped .shp, .shx, .dbf, .prj and .cpg with ELEV, UNIT and INDEX fields, in the coordinates chosen for DXF.
7357 × 8000 px
Add up to 20 areas, then download every chosen format for all of them in one zip, each area in its own folder in its local UTM zone.
Everything above the line stays free and unlimited. Pro adds CAD and print files, 1 m lidar for US sites, areas up to 2,000 km² and batches.
$9.99
One payment, every Pro feature for 7 days. No renewal.
$49 / year
Every Pro feature for a year. Renews yearly until you cancel.
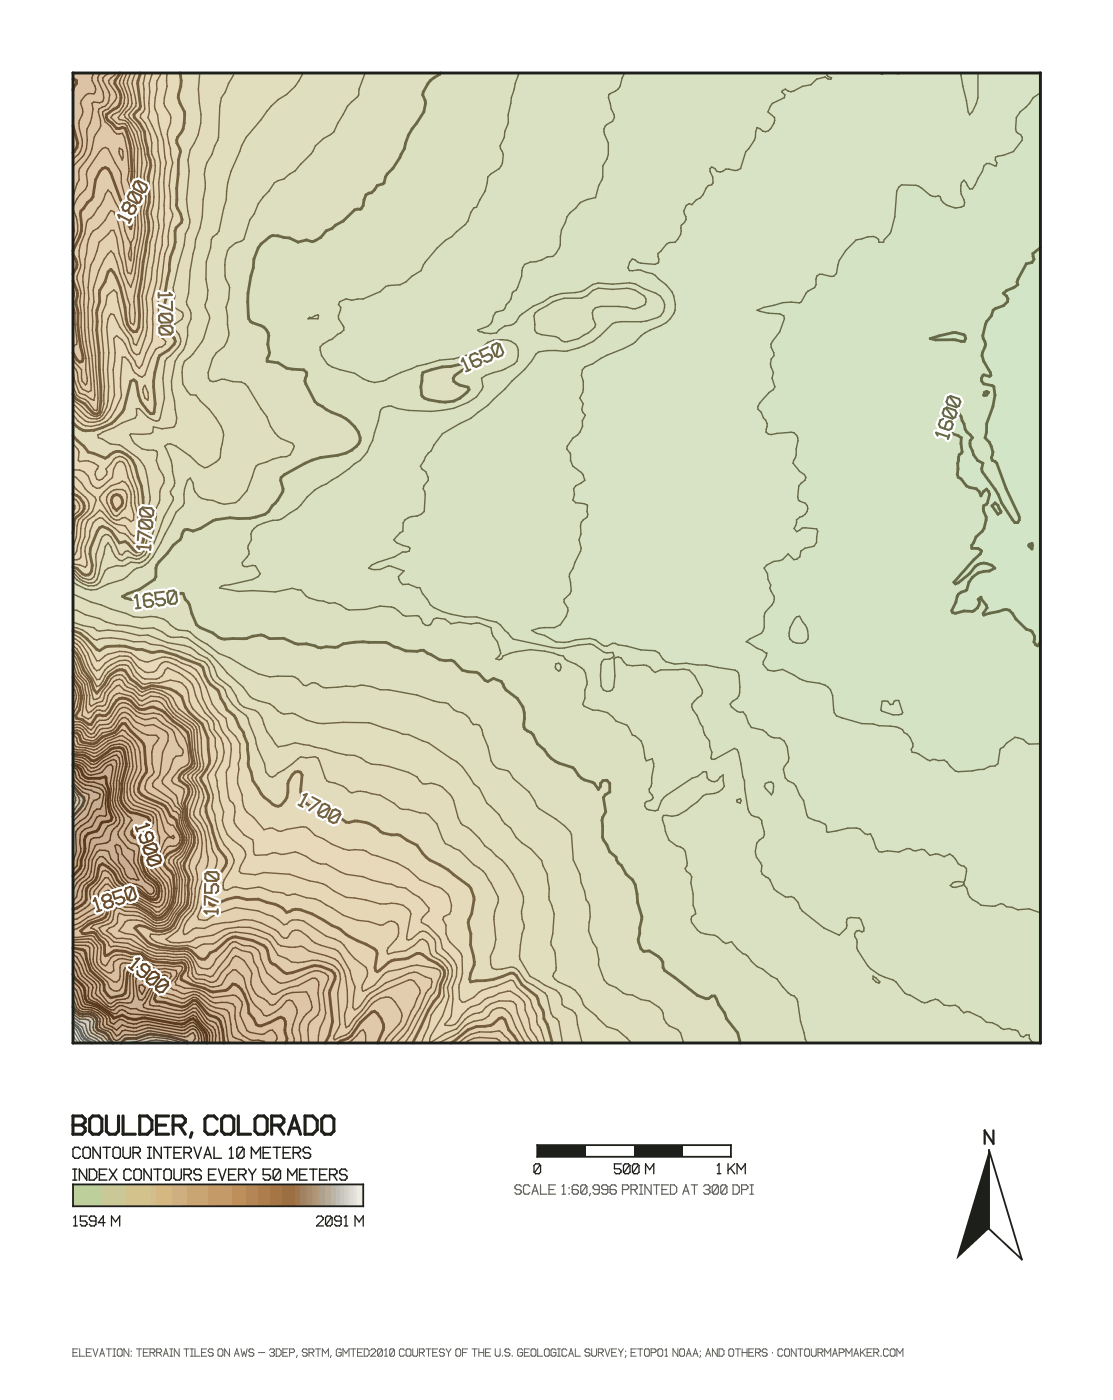
Plots of the contours behind each DXF, rendered by the tool's own code in the coordinate system named on the sheet. Open one to load the area; the layer preview under DXF for CAD shows what the file will contain.
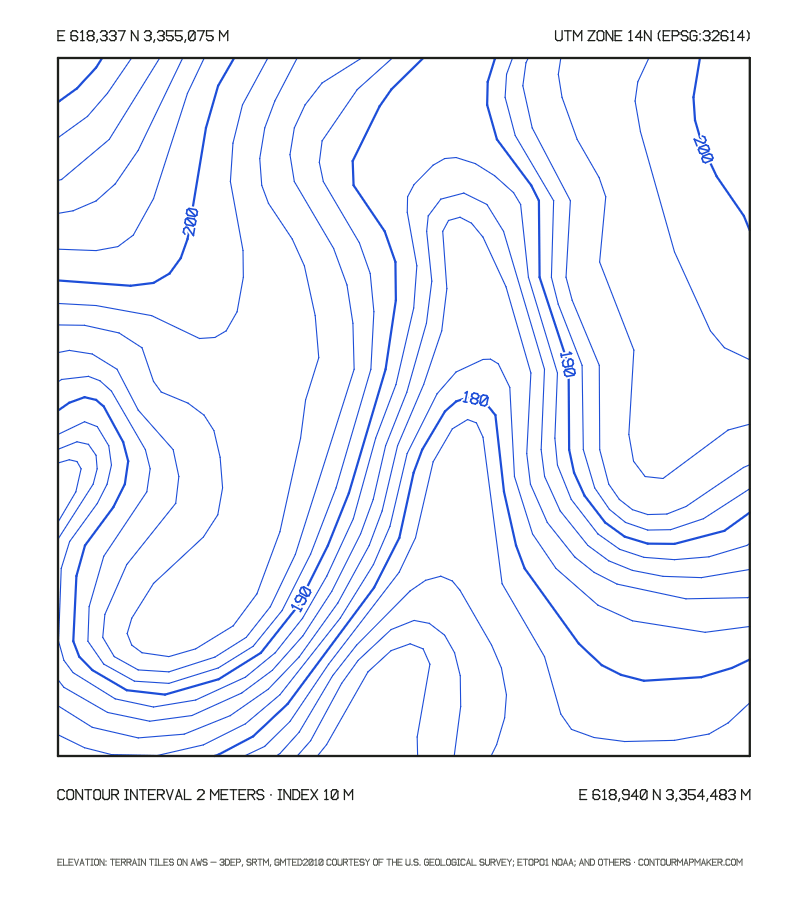
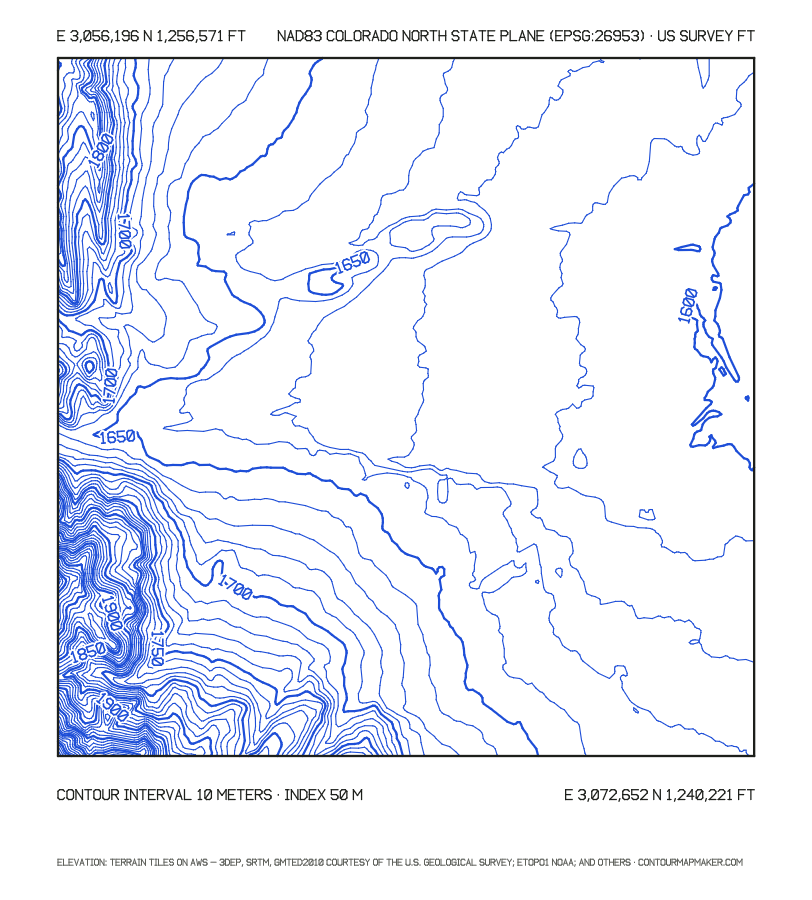
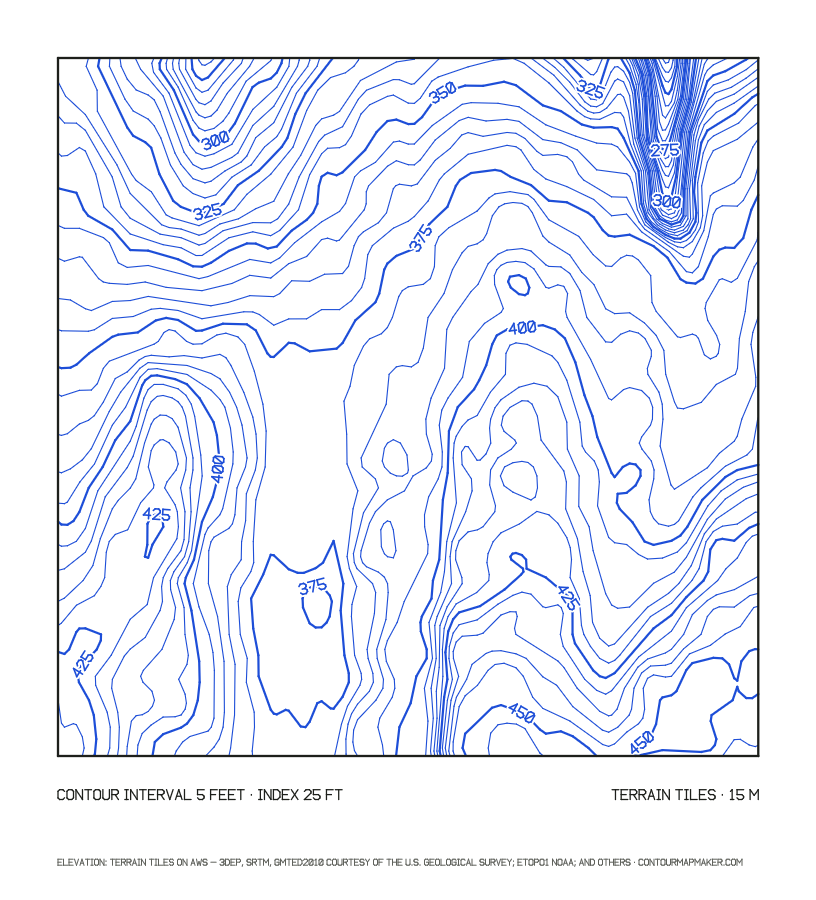
The file is DXF release 12 (AC1009), the version every CAD reader opens, from current AutoCAD and Civil 3D to LibreCAD, QGIS and GDAL. Each contour line is one POLYLINE entity with its elevation as the Z value, so the drawing is 3D from the start. Closed rings such as hilltops come in as closed polylines; lines that cross the edge of your area stay open.
| Part | What you get |
|---|---|
| Layers | One per elevation: CONTOUR_1600, CONTOUR_1602_5, CONTOUR_-20 for sea-floor lines |
| Colors | Index layers in AutoCAD color 30 (orange), others in 33 (light brown) |
| Elevation | Polyline elevation and the Z of every vertex, in your drawing units |
| Coordinates | WGS84 longitude/latitude, the UTM zone of the area, or a NAD83 State Plane zone |
| Units | Meters, international feet or US survey feet, set in $INSUNITS so CAD scales on insert |
| Notes | Coordinate system, units, interval and data credit as comments at the top of the file |
In AutoCAD, open the DXF on its own or insert it into your project drawing. Because the units are set in the file, AutoCAD scales it on insert. In Civil 3D, use the polylines as surface data: create a TIN surface, open its definition in Prospector, right-click Contours, choose Add and select the lines. The surface picks up the elevations directly. Index layers make it easy to freeze the intermediate lines on a plotted sheet.
SketchUp Pro imports DXF under File, Import, AutoCAD Files. Set the import units to match the drawing units you chose, import, then select the contours and run Sandbox, From Contours to build a terrain mesh you can place a model on. A small area with a 1 or 2 m interval keeps the mesh light. SketchUp Free cannot import DXF.
QGIS opens the DXF as a vector layer, but GIS users are usually better served by the GeoJSON (free) or the zipped Shapefile (Pro), which carry the elevation as an ELEV attribute and, for the Shapefile, a .prj file with the coordinate system.
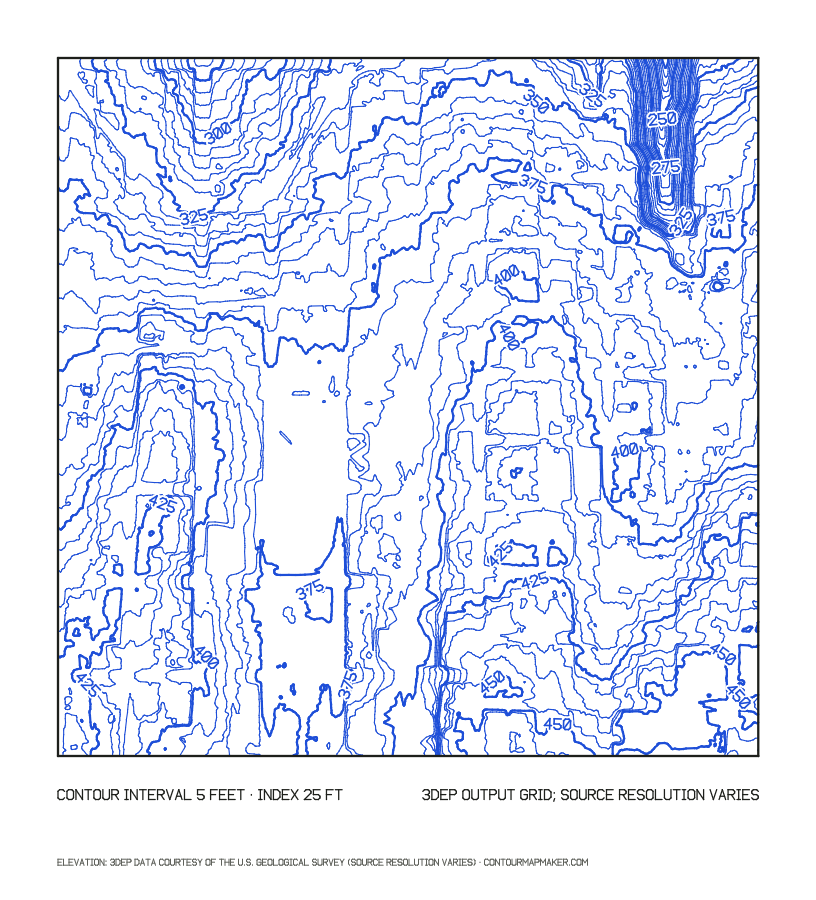
Free contours come from Terrain Tiles: about 10 m data in the US and about 30 m elsewhere, resampled to about 15 m for small areas. That is enough for the shape of a hill but not for a lot line, a driveway or a drainage swale. With Pro, choose USGS 3DEP 1 m lidar as the data source and the browser downloads the bare-earth model straight from the USGS National Map service. The comparison above shows the difference on Queen Anne Hill in Seattle: 260 lines against 83 over the same square kilometer.
A 3D site base for massing studies and early design in SketchUp, Revit or Rhino before a survey is ordered.
Feasibility surfaces in Civil 3D for road alignments, pads and earthwork estimates, replaced later by survey data.
Contours on the right layers for grading concepts, planting on slopes and drainage sketches. The land contour map guide covers reading drainage.
Contours with real heights for site models, studio projects and laser-cut terrain.
For CAD, the interval should match what the data supports: 1 to 2 ft or 0.5 m with US lidar, and 5 m or more with the free data. Find your area and relief below, and check the data column.
| Area you select | Terrain | Relief | Interval, m | Interval, ft | Data that supports it |
|---|---|---|---|---|---|
| House lot or building site, under 0.1 km² (25 acres) | Gentle to hillside | 5–25 m | 0.5 | 1–2 | 3DEP 1 m lidar (Pro, US) for survey-grade lines; free data shows the shape |
| Small farm or acreage, 0.1–2 km² | Rolling | 20–100 m | 0.5–2 | 2–10 | 3DEP 1 m lidar (Pro, US) for survey-grade lines; free data shows the shape |
| Farm, ranch or park, 2–10 km² | Hilly | 100–300 m | 2–10 | 10–20 | 3DEP 1 m lidar (Pro, US) for survey-grade lines; free data shows the shape |
| Town or valley, 10–50 km² | Hills to foothills | 300–800 m | 10–20 | 20–80 | Free data in the US; elsewhere use 20 m or more |
| Mountain area, 50–100 km² (free limit) | Mountains | 800–2,000 m | 20–50 | 80–200 | Free data, worldwide |
| Range or region, 100–2,000 km² (Pro) | High mountains | 1,500–4,000 m | 50–100 | 100–500 | Free data, worldwide |
Relief is the highest minus the lowest elevation in your selection (the tool shows both under Map data). Interval = relief ÷ 50, rounded up to 0.5, 1, 2, 5, 10, 20, 25, 50, 100 or 200 m (1, 2, 5, 10, 20, 40, 50, 80, 100, 200, 250 or 500 ft). The last column applies the 1947 National Map Accuracy Standard, interval ≥ 3.29 × the data's vertical RMSE: about 0.3 m for lidar, 5.1 m for the US 10 m data and 18 m for SRTM.
Yes. Every contour is a 3D polyline whose elevation is its height, repeated as the Z value of each vertex, so AutoCAD, Civil 3D and SketchUp place the lines at their real heights. Each elevation is also on its own layer named CONTOUR_ followed by the height, for example CONTOUR_1600.
You choose: WGS84 longitude and latitude, the UTM zone of your area in meters, or a NAD83 State Plane zone in the US. Drawing units can be meters, international feet or US survey feet. The choice, the units and the interval are written as comments at the top of the file.
The tool writes DXF, which AutoCAD, Civil 3D, BricsCAD and SketchUp Pro open directly. To get a DWG, open the DXF in AutoCAD or BricsCAD and save it as DWG, or convert it with the free ODA File Converter.
Open or insert the DXF, create a TIN surface, then in Prospector expand the surface definition, right-click Contours and choose Add. Select the contour polylines and keep weeding and supplementing at their defaults. The polylines already carry their elevations, so the surface builds without editing.
SketchUp Pro imports DXF through File, Import with the AutoCAD Files type. Choose the matching units in the import options, then use the Sandbox tool From Contours on the imported lines to build a terrain mesh. SketchUp Free on the web does not import DXF; export the SVG instead for a flat plan.
A lidar contour map is drawn from a laser-scanned ground model rather than a satellite one. With Pro, choose USGS 3DEP 1 m lidar as the data source for an area in the United States. Areas up to 10 km² are sampled at 1 m; larger areas are sampled coarser and say so. Outside the US, use the worldwide Terrain Tiles data.
It is a good base for planning, feasibility and design concepts. It is not a survey: the contours come from public elevation data with the accuracy listed on this page, and permit drawings, grading plans and boundary work need a licensed surveyor.