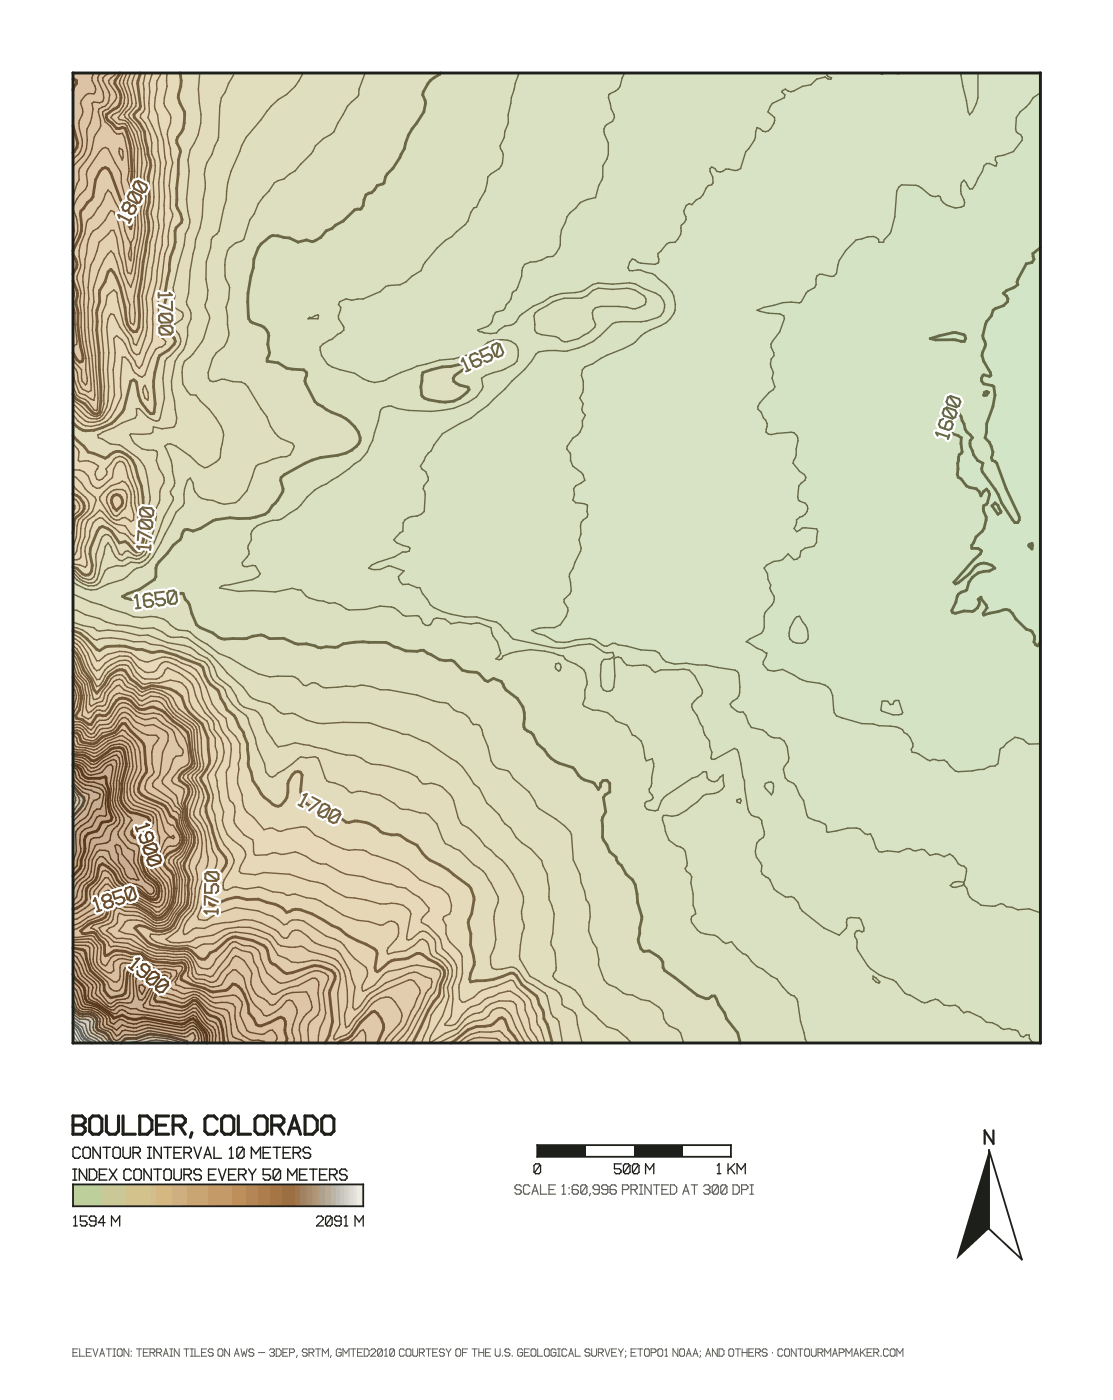
Reading three pieces of land
Rendered from free data by the tool's code at a 1 or 2 m interval. Open one to load the area; for your own land, import its boundary instead.
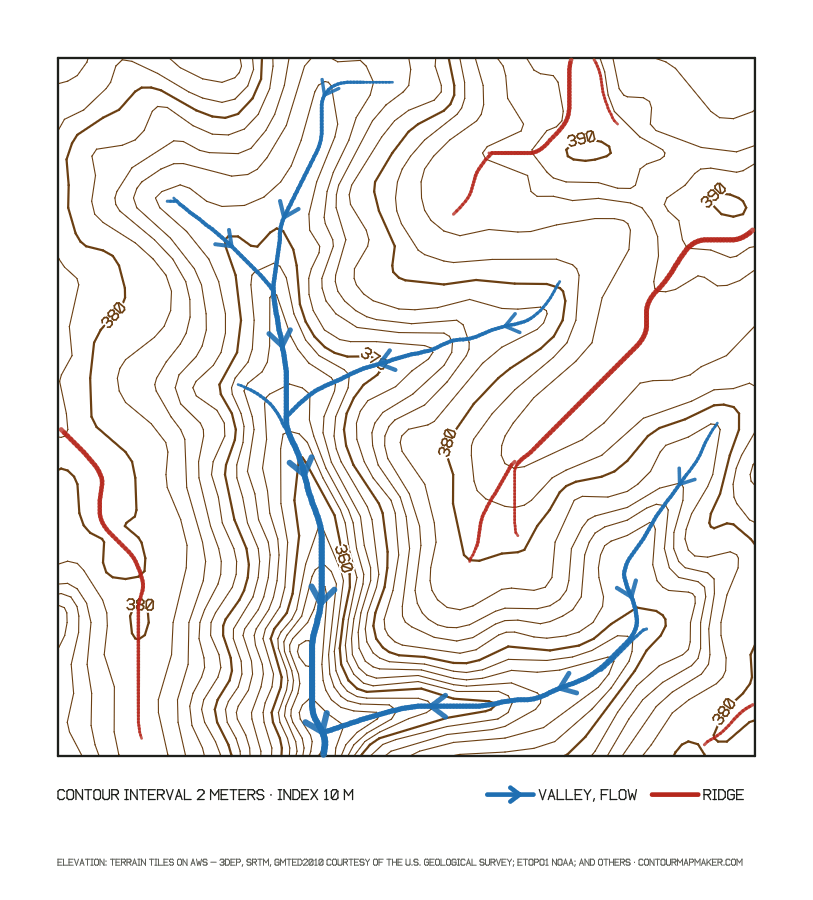
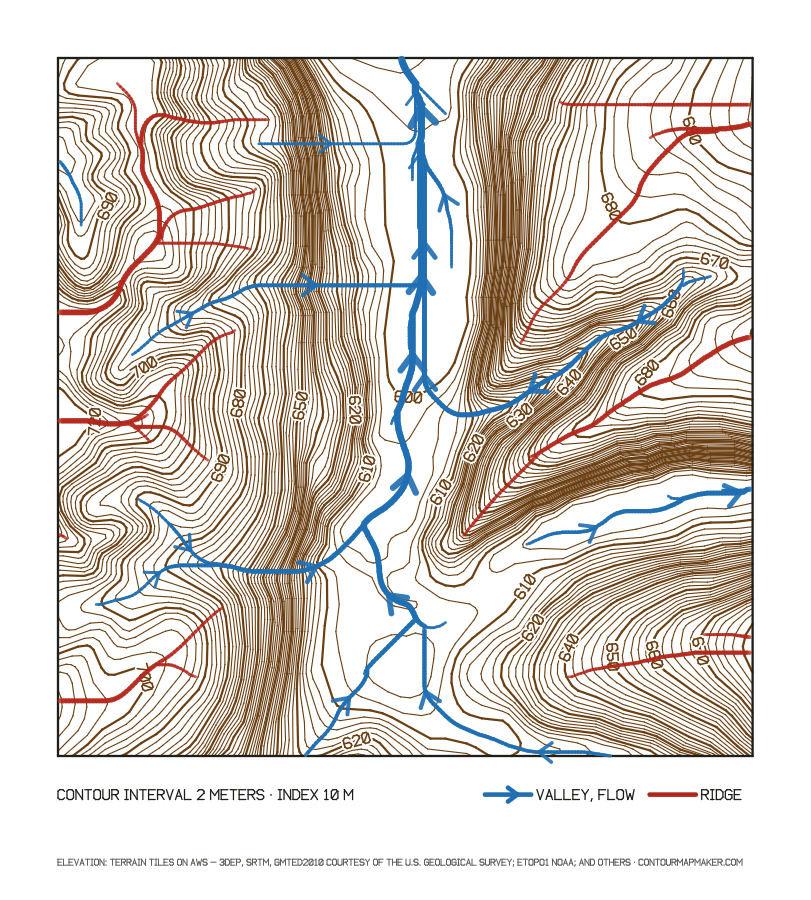
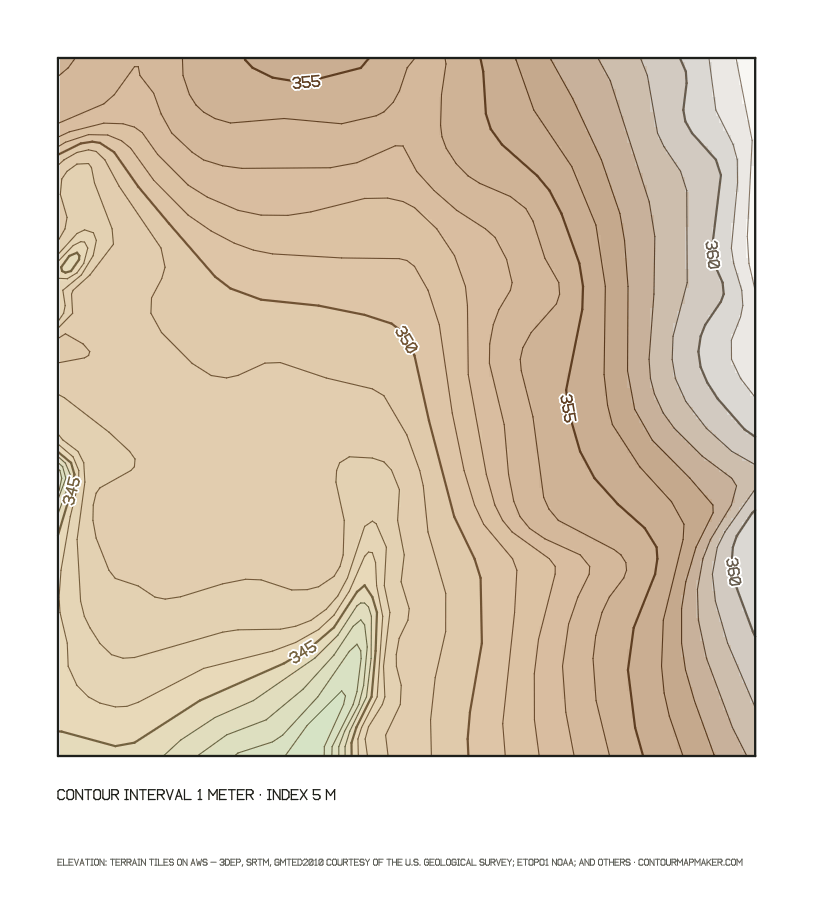
How to read a land contour map
A land contour map turns a parcel into a set of level lines. Everything you need to judge the land comes from four patterns. Spacing tells you steepness: with 2 m contours, lines 40 m apart describe a 5% slope and lines 10 m apart a 20% slope. The elevation contour map guide has the full spacing-to-slope table.
- Valleys and draws: contours bend into V's or U's whose points aim uphill. Water collects there; expect wet ground, culverts and the best pond sites.
- Ridges and spurs: the V's point downhill. Ridges are dry, well drained and often the best spots for a track or a building.
- Knolls and hollows: closed rings. If the numbers rise toward the middle it is a knoll; if they fall, a hollow that holds water.
- Saddles: two pairs of rings facing each other, the low point between two highs. Roads and trails often cross ridges there.
Drainage, keylines, swales and terraces
Water flows downhill at right angles to the contours. To trace it, start anywhere, move perpendicular to the lines toward lower numbers, and you will end in the nearest valley. Follow the valleys down and you find where water leaves the property; follow the ridges and you find where it divides. On a farm, that map of where water comes from and where it goes is the start of every earthworks plan.
Keylines
P. A. Yeomans' Keyline method (The Keyline Plan, 1954) starts from the keypoint of each main valley, where the valley floor changes from steep to gentle and the contours start to spread apart. The contour through that point is the keyline. Ripping or cultivating parallel to it, falling very slightly toward the ridges, spreads water out of the valleys onto the drier ridges instead of letting it rush down the center. On a contour map, look for the place in each valley where the spacing between lines suddenly widens.
Swales
A swale is a ditch dug exactly on contour with the soil piled on the downhill side as a berm. Because it is level, it stops runoff and lets it soak in rather than moving it along. The map tells you where swales make sense: on long, even slopes of roughly 2% to 15% above the area you want to water. It cannot tell you where the level line runs to the centimeter, so peg it on the ground with a level before digging.
Terraces
Terraces turn a slope into a series of level or nearly level steps along the contours. Broad-base terraces you can drive over suit cropland up to the low teens of percent slope; narrower bench terraces are for steeper ground, gardens and vineyards. A contour map at 1 or 2 m shows how many steps a slope needs and how far apart they fall.
What each slope class means
Slope classes are a planning shortcut, not a building code. The spacing column tells you how far apart 2 m contours sit on the map for each class (spacing = 100 × interval ÷ slope %), so you can classify a slope at a glance.
| Slope | 2 m contours apart | Building | Drainage | Terraces and crops | Machinery |
|---|---|---|---|---|---|
| 0–2% Flat | more than 100 m | Easy, but the pad must be graded so water runs away from the house | Slow; puddles and wet spots | Not needed | Any equipment |
| 2–5% Gentle | 40 m to 100 m | The easiest house sites, little cut and fill | Drains well without erosion | Contour farming on long slopes | Any equipment |
| 5–10% Moderate | 20 m to 40 m | Some cut and fill; suits walkout basements | Runoff gathers speed; swales and diversions help | Contour strips or broad-base terraces on cropland | Normal field work |
| 10–15% Strong | 13 m to 20 m | Stepped foundations, retaining walls, steeper driveways | High erosion risk on bare soil | Needed for crops; pasture is easier | Work across the slope with care |
| over 15% Steep | less than 13 m | Engineering required; often under hillside rules | Fast runoff; keep in permanent cover | Bench terraces, or leave in grass or woods | Rollover risk for tractors |
For drainage around a house, the International Residential Code (section R401.3) asks for 6 inches of fall in the first 10 feet away from the foundation, a 5% slope. Local rules vary; check them before you design.
Choosing a house site
On a site contour map, the best house sites usually share three things. They sit where the lines are widest apart, roughly 2% to 8%, so the pad needs little cut and fill. They sit on a ridge, spur or bench rather than in a valley, so water drains away from the house instead of toward it. And they leave a reasonable driveway: count the contours between the road and the site and divide the rise by the distance to get the grade, then compare it with your local driveway limit. Avoid the bottoms of draws, closed hollows and the foot of long slopes, which collect runoff, and check the shape of the land against the flood maps for the area.
Before you buy, use the map to ask better questions on site: where does the water go in a storm, which part of the field stays wet, how much of the parcel is too steep to use? The contours are generated from public elevation data and are not a substitute for a field survey or a licensed land survey, which any real design, permit or boundary question needs.
How to make a contour map of your land from its boundary
- Get the boundary file. Many county GIS parcel viewers export a parcel as KML or GeoJSON. In Google Earth Pro, draw the boundary with Add Polygon, then right-click it, choose Save Place As and pick KML. A listing or survey may come with one too.
- Import it. Under Area, press Choose KML or GeoJSON file and pick it. It must hold a Polygon or MultiPolygon in longitude and latitude and be under 5 MB. The file is read in your browser and never uploaded.
- Check the outline. The map zooms to the parcel and the Shape line confirms the contours are clipped to it. If the file is rejected, the message says why: wrong type, too large, no polygon or coordinates that are not longitude and latitude.
- Pick a fine interval. This page starts at 2 m. For a lot or small acreage try 1 m (or 2 to 5 ft); the interval table below covers larger farms.
- Read and save the map. Map data shows the lowest and highest point and the mean slope. Download the PNG to print, the KML for Google Earth or the GeoJSON for a GIS, or copy a share link for a buyer, builder or designer.
How to choose a contour interval
For a single parcel, 1 or 2 m (2 or 5 ft) shows the drainage; for a large farm, aim for 25 to 50 levels over the relief. The free data shows the shape at those intervals; individual lines can be a few meters off outside lidar.
| Area you select | Terrain | Relief | Interval, m | Interval, ft | Data that supports it |
|---|---|---|---|---|---|
| House lot or building site, under 0.1 km² (25 acres) | Gentle to hillside | 5–25 m | 0.5 | 1–2 | 3DEP 1 m lidar (Pro, US) for survey-grade lines; free data shows the shape |
| Small farm or acreage, 0.1–2 km² | Rolling | 20–100 m | 0.5–2 | 2–10 | 3DEP 1 m lidar (Pro, US) for survey-grade lines; free data shows the shape |
| Farm, ranch or park, 2–10 km² | Hilly | 100–300 m | 2–10 | 10–20 | 3DEP 1 m lidar (Pro, US) for survey-grade lines; free data shows the shape |
| Town or valley, 10–50 km² | Hills to foothills | 300–800 m | 10–20 | 20–80 | Free data in the US; elsewhere use 20 m or more |
| Mountain area, 50–100 km² (free limit) | Mountains | 800–2,000 m | 20–50 | 80–200 | Free data, worldwide |
| Range or region, 100–2,000 km² (Pro) | High mountains | 1,500–4,000 m | 50–100 | 100–500 | Free data, worldwide |
Relief is the highest minus the lowest elevation in your selection (the tool shows both under Map data). Interval = relief ÷ 50, rounded up to 0.5, 1, 2, 5, 10, 20, 25, 50, 100 or 200 m (1, 2, 5, 10, 20, 40, 50, 80, 100, 200, 250 or 500 ft). The last column applies the 1947 National Map Accuracy Standard, interval ≥ 3.29 × the data's vertical RMSE: about 0.3 m for lidar, 5.1 m for the US 10 m data and 18 m for SRTM.
Frequently asked questions
How do I make a contour map of my property?
Import the property boundary as a KML or GeoJSON file under Area, or draw the outline on the map, then pick a 1 or 2 m interval. The contours are clipped to the boundary and can be downloaded as a PNG, KML or GeoJSON for free.
Which way does water flow on a contour map?
Water runs downhill at right angles to the contour lines. Where the lines form a V or U, the point of the V aims uphill in a valley, so water collects and runs down the middle of the V. On a ridge the V points downhill and water runs off both sides.
Is the free data detailed enough for a small lot?
For the general fall of a lot, where water goes and which part is flattest, yes. For a building pad, a septic field or a driveway design, no: the free data is about 10 m in the US and 30 m elsewhere. In the US, Pro adds 1 m lidar, and any construction work needs a site survey.
What slope is too steep to build on?
There is no single number. Under about 10% most houses go up without major earthwork; between 10% and 15% expect stepped foundations and retaining walls; above 15% many places add hillside rules and you will need an engineer. Check your local building and grading rules.
Can I lay out swales or keylines from this map?
Use it to plan where they go: which slopes, which valleys, how long. Then stake them on the ground with a laser level, a water level or an A-frame, because a swale must be truly level and the data cannot place a line to the centimeter.
What is a site contour map?
A site contour map is a contour map of one building site or parcel at a fine interval, used to plan the house, driveway and drainage. This tool makes a planning version from public data; the version an architect or engineer builds on comes from a topographic survey of the site.