Land buyers and farmers
See slope and drainage over the aerial photo of a parcel before visiting. The land contour map guide explains how to read it.
Add contour lines to Google Earth: pick your area and interval, download a free KML, then open it in Google Earth Pro or on the web.
A .kml, .geojson or .json file with a Polygon or MultiPolygon, up to 5 MB. It is read in your browser and never uploaded. Samples: boulder-triangle.kml, test-parcel.geojson.
Every Nth contour is drawn bold (0 turns index lines off).
Terrain Tiles combine USGS 3DEP (about 10 m) in the US with SRTM and other 30 m data elsewhere, read on a 15 m grid (30 m above 100 km²).
Line colors follow elevation while Coloring is set to Elevation tints.
Contour interval 10 meters
Loading elevation for Boulder, CO…
Elevation: Terrain Tiles on AWS Open Data (USGS 3DEP, SRTM, GMTED2010 courtesy of the U.S. Geological Survey; ETOPO1 NOAA; and others) and, for Pro lidar, USGS 3DEP 1 m. Basemap, roads and place search © OpenStreetMap contributors (Nominatim). Full credits
Contours are generated from public elevation data. Accuracy depends on the source data, and they are not a substitute for a field survey or a licensed land survey.
The legend appears when the contours are ready.
Nothing saved yet. Saves stay in this browser only (localStorage).
Built on our server, in memory, from the contours on the map. Nothing is stored. Pricing
Layers appear when the contours are ready.
Groups appear when the contours are ready.
A folder per elevation, colored lines, labeled index lines and a legend overlay.
Zipped .shp, .shx, .dbf, .prj and .cpg with ELEV, UNIT and INDEX fields, in the coordinates chosen for DXF.
7357 × 8000 px
Add up to 20 areas, then download every chosen format for all of them in one zip, each area in its own folder in its local UTM zone.
Everything above the line stays free and unlimited. Pro adds CAD and print files, 1 m lidar for US sites, areas up to 2,000 km² and batches.
$9.99
One payment, every Pro feature for 7 days. No renewal.
$49 / year
Every Pro feature for a year. Renews yearly until you cancel.
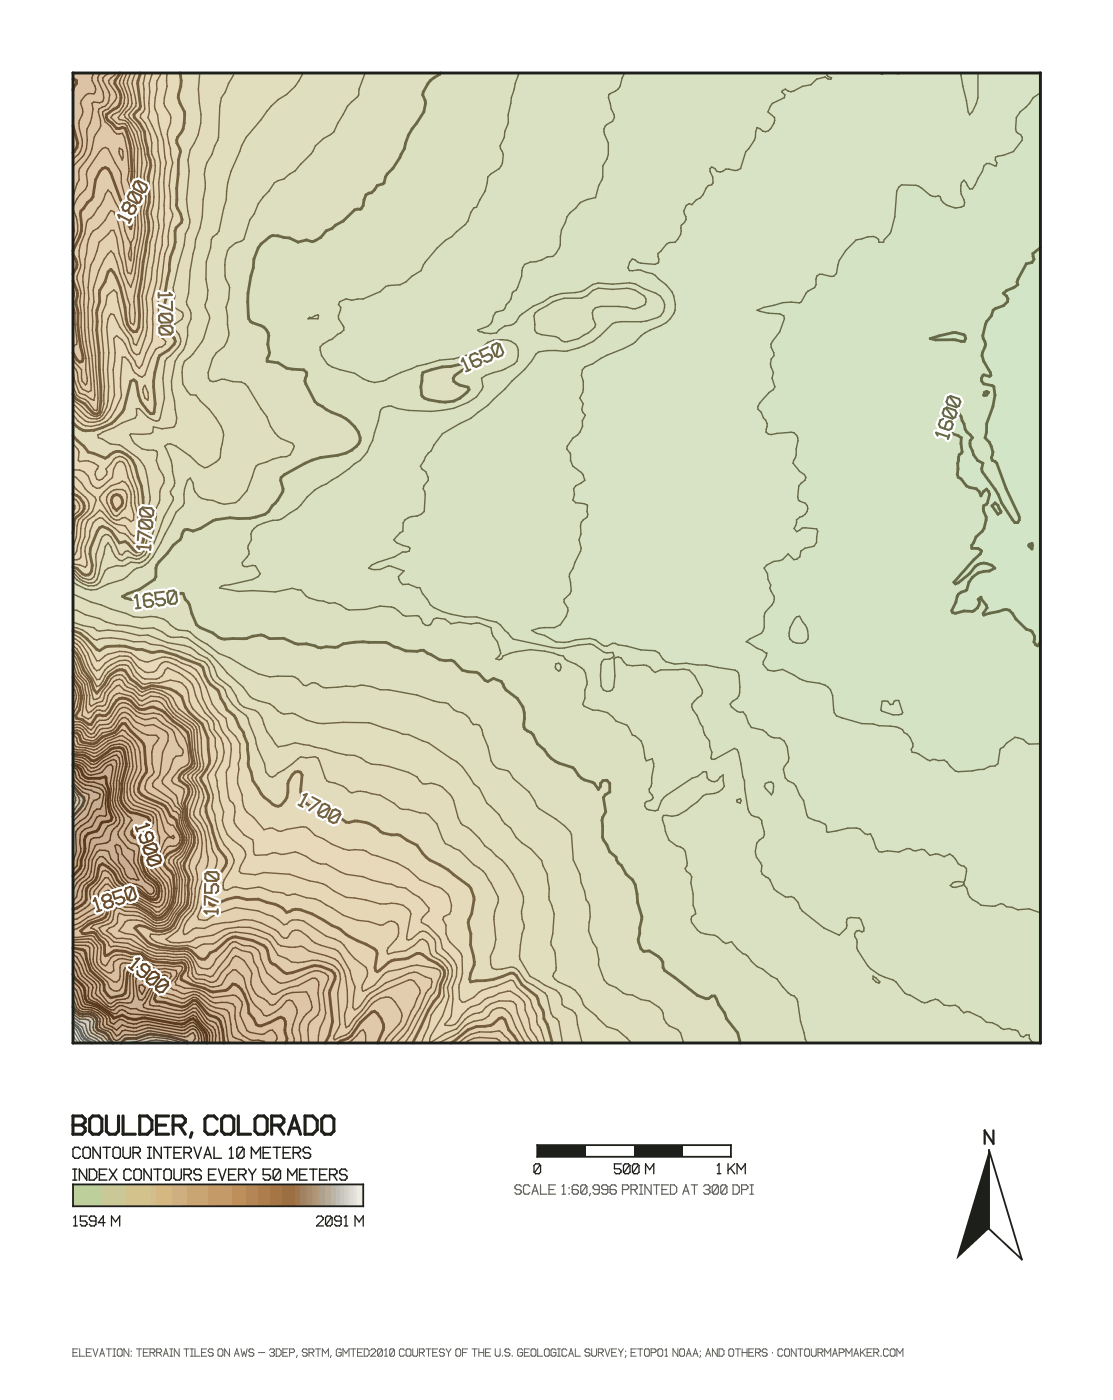
These are the contours the KML files hold, rendered flat by the tool's own code at the settings shown. Open one to load it, then download the KML and drape it over Google Earth.
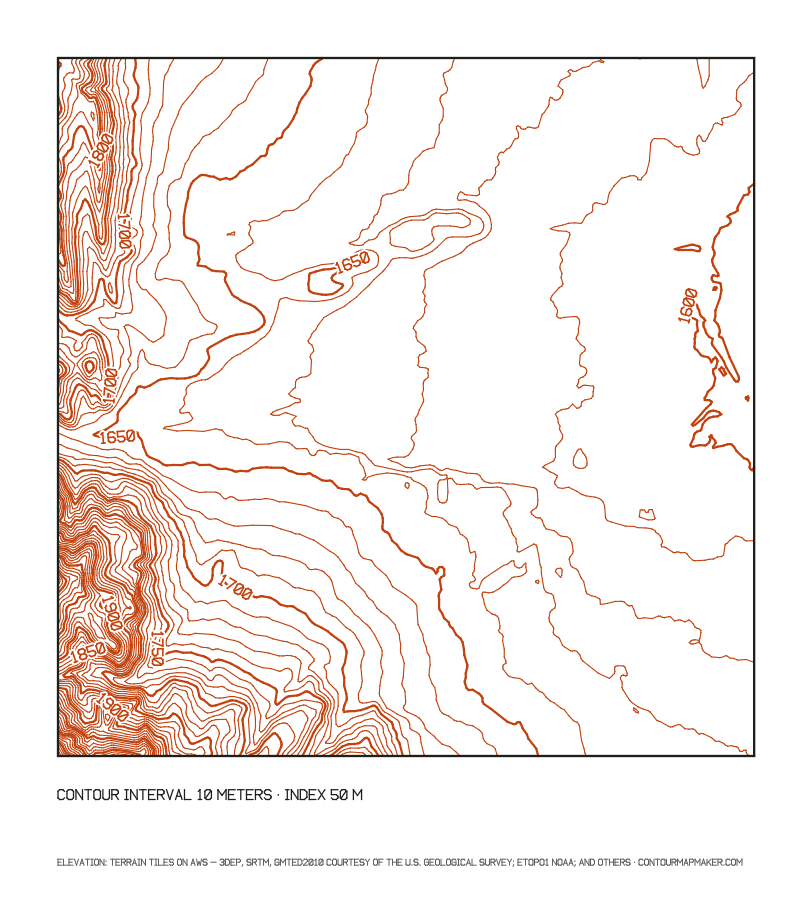
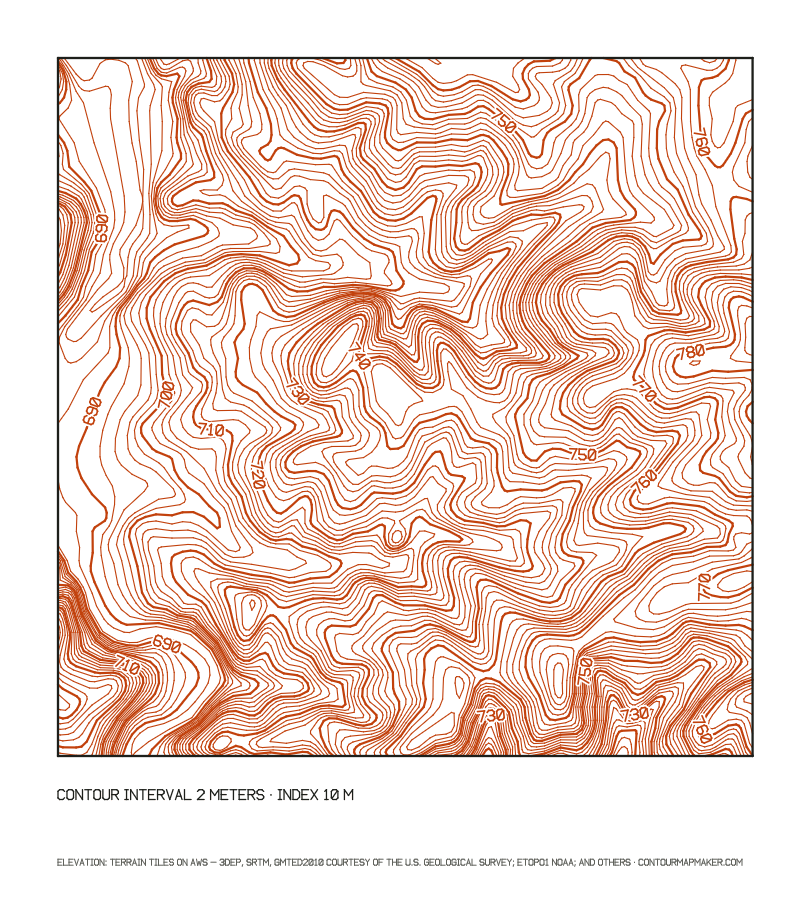
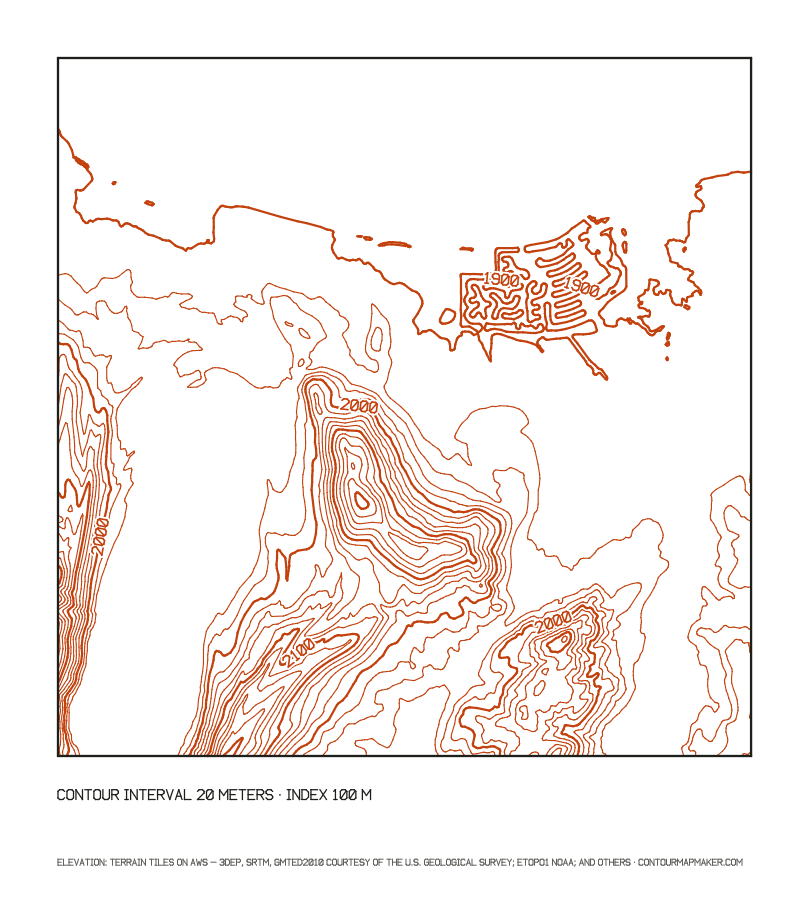
KML is the XML format Google Earth reads natively, standardized by the Open Geospatial Consortium as OGC 07-147r2. A KMZ is a KML zipped together with the images it uses. Both files from this tool hold real LineStrings in WGS84 longitude and latitude, the coordinate system Google Earth uses, so no reprojection or import settings are needed.
| KML, free | KMZ, Pro | |
|---|---|---|
| Structure | One folder with every line | One folder per elevation, highest first |
| Color | Your line color | Your line color, or colored by elevation |
| Index lines | In the same folder | Wider, with a label at each index line |
| Legend | None | Screen overlay legend (Google Earth Pro) |
| Opening view | Your area | Your area, tilted 40° to show the relief |
| Altitude | Clamped to the ground; each vertex also stores the line's elevation in meters | |
| Credit | Data credit and disclaimer in the document description | |
Double-click the .kml or .kmz, or choose File, Open. The contours land in Temporary Places in the sidebar; drag them into My Places to keep them. Click a line to see its elevation. To check the overlay against Google's own terrain, hover over a contour and read the elevation in the status bar at the bottom of the window. In the line's Properties, the Altitude tab switches between Clamped to ground and Absolute; Absolute floats each line at its stored height, which is a neat way to see where the two terrain models disagree.
Google Earth on the web imports KML and KMZ into a project: open Projects, choose New project, then Import KML file from computer. Projects are kept in your Google account, so you can reopen the contours on another computer. Large files with thousands of lines take a few seconds to draw; for a big area, a larger interval keeps the overlay fast.
Google Earth draws its 3D surface from its own elevation sources, while these contours come from Terrain Tiles (USGS 3DEP in the US, SRTM and others elsewhere) or USGS lidar. Lines are clamped to the ground, so they always follow the surface you see, but where Google's model differs from the source data a line can sit a few meters uphill or downhill of the height it is labeled with. On a farm this rarely matters; on a cliff it shows. For a reading you can rely on, use the numbers in the file, and remember: contours are generated from public elevation data and are not a substitute for a field survey or a licensed land survey.
See slope and drainage over the aerial photo of a parcel before visiting. The land contour map guide explains how to read it.
Plan a route on the 3D terrain with contour lines that show the real steepness of each slope.
Share one KMZ with clients that shows building sites, slopes and access in a viewer everyone already has.
Drape contours over a familiar landscape in 3D to show how flat lines describe hills and valleys.
Google Earth draws every line you give it, so pick an interval that keeps 25 to 50 levels over your area; for a single parcel, 1 or 2 m (2 or 5 ft) is usually right. Find your area and relief below.
| Area you select | Terrain | Relief | Interval, m | Interval, ft | Data that supports it |
|---|---|---|---|---|---|
| House lot or building site, under 0.1 km² (25 acres) | Gentle to hillside | 5–25 m | 0.5 | 1–2 | 3DEP 1 m lidar (Pro, US) for survey-grade lines; free data shows the shape |
| Small farm or acreage, 0.1–2 km² | Rolling | 20–100 m | 0.5–2 | 2–10 | 3DEP 1 m lidar (Pro, US) for survey-grade lines; free data shows the shape |
| Farm, ranch or park, 2–10 km² | Hilly | 100–300 m | 2–10 | 10–20 | 3DEP 1 m lidar (Pro, US) for survey-grade lines; free data shows the shape |
| Town or valley, 10–50 km² | Hills to foothills | 300–800 m | 10–20 | 20–80 | Free data in the US; elsewhere use 20 m or more |
| Mountain area, 50–100 km² (free limit) | Mountains | 800–2,000 m | 20–50 | 80–200 | Free data, worldwide |
| Range or region, 100–2,000 km² (Pro) | High mountains | 1,500–4,000 m | 50–100 | 100–500 | Free data, worldwide |
Relief is the highest minus the lowest elevation in your selection (the tool shows both under Map data). Interval = relief ÷ 50, rounded up to 0.5, 1, 2, 5, 10, 20, 25, 50, 100 or 200 m (1, 2, 5, 10, 20, 40, 50, 80, 100, 200, 250 or 500 ft). The last column applies the 1947 National Map Accuracy Standard, interval ≥ 3.29 × the data's vertical RMSE: about 0.3 m for lidar, 5.1 m for the US 10 m data and 18 m for SRTM.
No. Google Earth Pro and Google Earth on the web show terrain in 3D and the elevation under your cursor, but neither draws contour lines. To see them, make the lines here and open the KML or KMZ in Google Earth as an overlay.
Download the KML, then double-click it or use File, Open in Google Earth Pro. The lines appear under Temporary Places and the view flies to your area. Drag the item into My Places if you want Google Earth to keep it after you close the program.
Open Google Earth in Chrome or another supported browser, go to Projects, choose New project and then Import KML file from computer, and pick the KML or KMZ you downloaded. The legend overlay of the Pro KMZ is designed for Google Earth Pro and may not show on the web.
The contours come from public elevation data, and Google Earth drapes them over its own terrain model. Where the two models differ, a line can sit a little uphill or downhill of where Google Earth puts that height. The lines are clamped to the ground, so they always follow the surface you see, and each one also stores its elevation as the coordinate altitude.
In the Pro KMZ every elevation is its own folder, so you can untick the folders you do not need. With the free KML, download a second file with the interval set to your index spacing, for example 50 m instead of 10 m, and switch between the two files in the Places panel.
Use the free KML for a quick overlay in one color with every line in one folder. Use the Pro KMZ when you want to read the map in Google Earth: a folder per elevation, colors by height, wider labeled index lines and a legend, all zipped into one file.