One area at three intervals
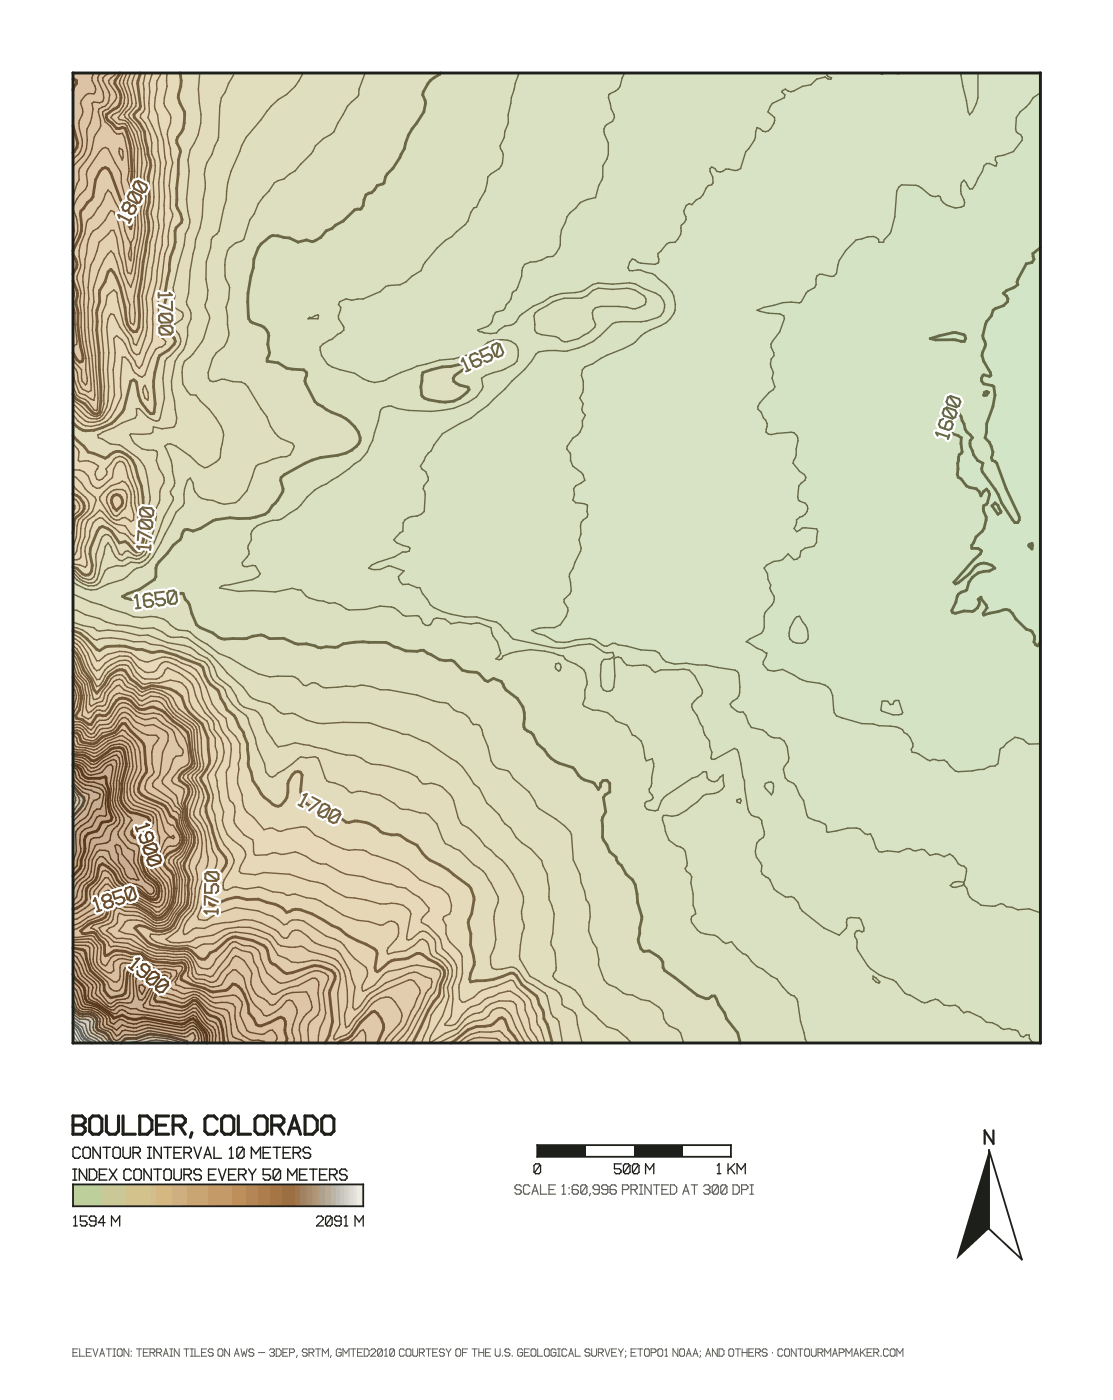
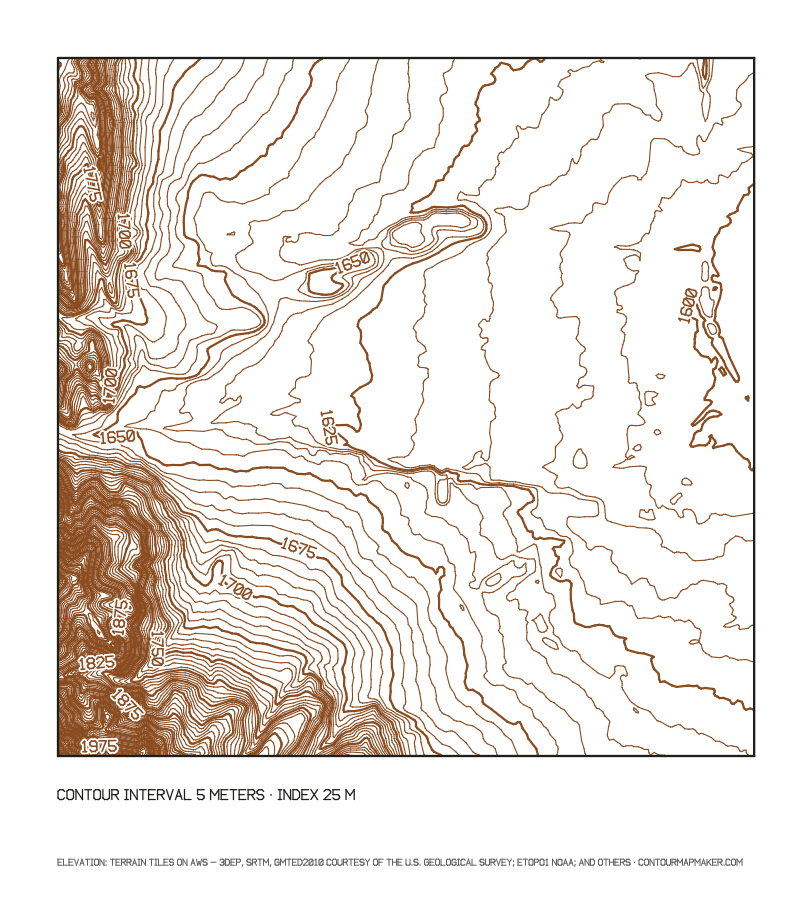
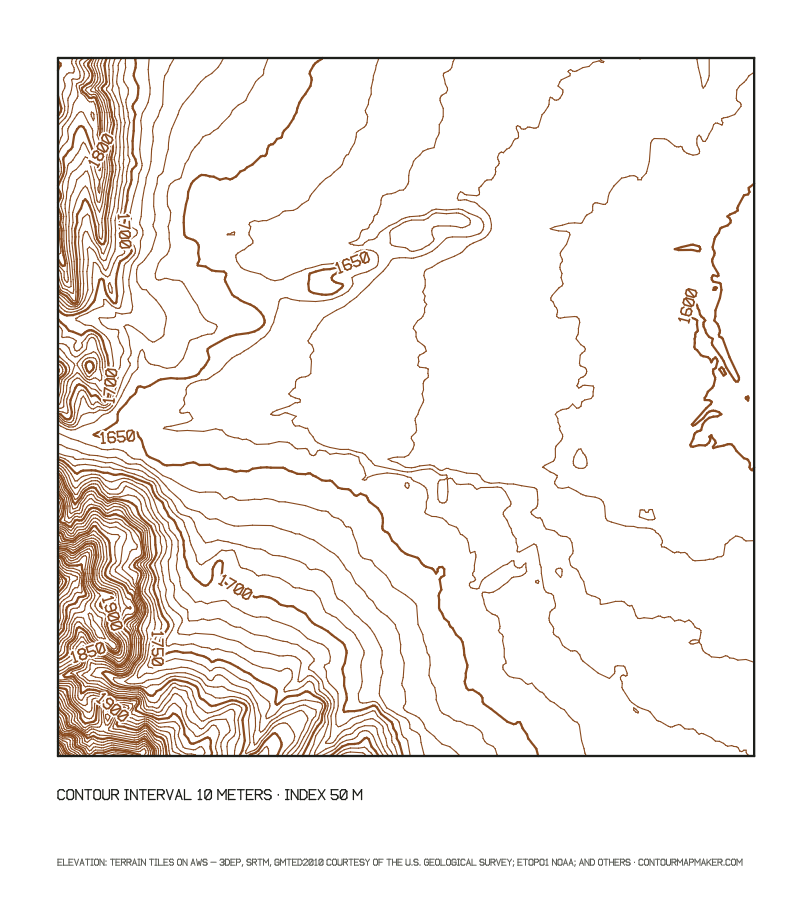
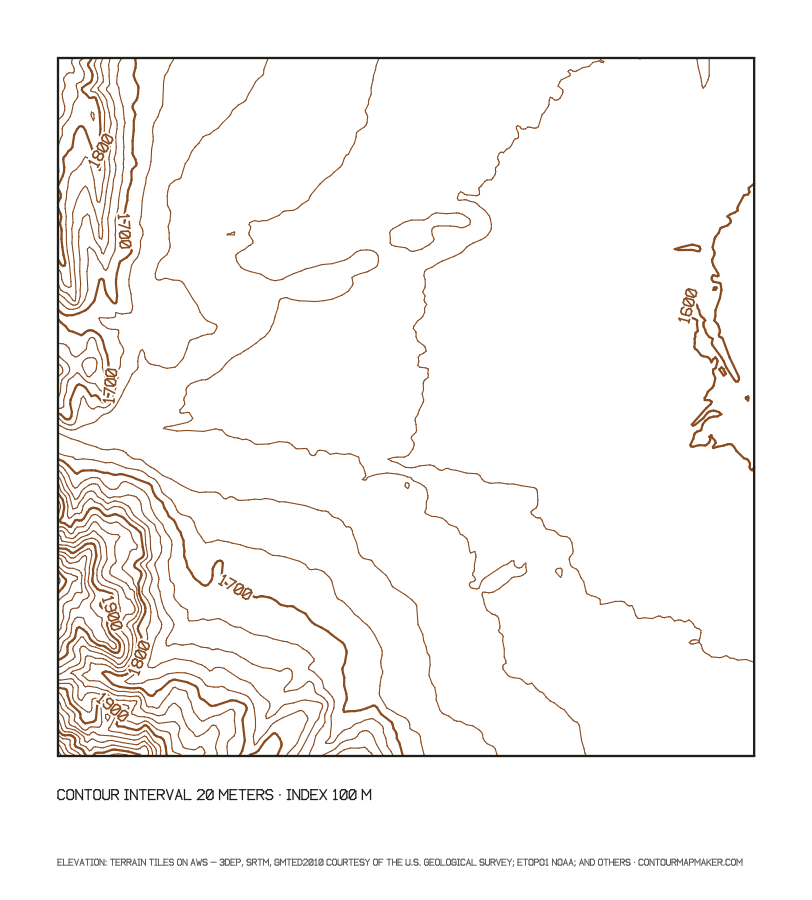
The same 497 m of relief over Boulder, Colorado, rendered by the tool at 5, 10 and 20 m with elevation tints. Open one to load it, then try your own interval.
Where the elevation data comes from
This elevation map generator builds contours from a grid of heights, one value per cell. The free data is Terrain Tiles, an open elevation mosaic on the Registry of Open Data on AWS. Each 256-pixel tile stores heights in the red, green and blue channels, decoded as elevation = R × 256 + G + B ÷ 256 − 32768 meters. The mosaic merges the best public source for each place, so the detail you get depends on where your area is.
| Source | Where | Cell size |
|---|---|---|
| USGS 3DEP (formerly NED) | United States | about 10 m (3 m in parts) |
| SRTM | Land from 60° N to 56° S | about 30 m |
| EU-DEM | Europe | about 30 m |
| ArcticDEM | Land north of 60° N | about 5 m |
| National models | UK (England), Austria, Norway, New Zealand, Australia, Canada, Mexico | 2 m to 400 m |
| GMTED2010 | Global, for large areas | about 250 m |
| ETOPO1 | Oceans and sea floor | about 1.8 km |
Source: the data sources table of the Tilezen joerd documentation. For areas up to 100 km² the tool reads tiles at about 15 m per pixel, so finer sources are resampled to that; larger Pro areas use about 30 m. Sea-floor contours come from ETOPO1 and are coarse.
For US sites, Pro adds USGS 3DEP 1 m lidar, downloaded by your browser from the USGS National Map. It is a bare-earth model, with buildings and trees removed, sampled at 1 m for areas up to 10 km². The contour map DXF page compares 1 m lidar with the free data on the same hill.
How accurate the contours are
A contour can only be as good as the grid under it. Elevation products state their vertical accuracy as RMSE, the root mean square difference from surveyed check points. The 1947 U.S. National Map Accuracy Standards ask that no more than 10% of tested points be off by more than half the contour interval. For normally distributed errors that works out to a smallest honest interval of 2 × 1.6449 × RMSE = 3.29 × RMSE, the conversion given in the ASPRS Positional Accuracy Standards for Digital Geospatial Data (2014).
| Data | Cell | RMSE | Finest interval | Accuracy source |
|---|---|---|---|---|
| USGS 3DEP lidar, quality level 2 | 1 m | 0.1 m | 0.3 m (1 ft) | USGS Lidar Base Specification: RMSEz ≤ 10 cm in open terrain |
| USGS 3DEP 1/3 arc-second (US part of Terrain Tiles) | about 10 m | 1.55 m | 5.1 m (17 ft) | Gesch, Oimoen and Evans (2014), USGS Scientific Investigations Report 2014-5008 |
| SRTM (most land outside the US in Terrain Tiles) | about 30 m | 5.5 m | 18.1 m (59 ft) | Rodríguez et al. (2006): 90% absolute error 5.6–9.0 m by continent, 9.0 m ÷ 1.6449 shown |
Two practical consequences. First, a 1 or 2 m interval on free data is still useful: neighboring cells share most of their error, so the shape of a slope, a swale or a ridge comes out right even when the absolute height of a line is a few meters off. Second, cliffs, narrow summits and dense forest are where the error concentrates. The Matterhorn reads 124 m low on the 30 m grid because the summit is narrower than a cell. Contours are generated from public elevation data and are not a substitute for a field survey or a licensed land survey.
How to choose a contour interval
Aim for 25 to 50 contour levels across your area: fewer and the shape of the land disappears, more and the lines merge on screen and on paper. Find your area and relief below, then check the free data can carry that interval.
| Area you select | Terrain | Relief | Interval, m | Interval, ft | Data that supports it |
|---|---|---|---|---|---|
| House lot or building site, under 0.1 km² (25 acres) | Gentle to hillside | 5–25 m | 0.5 | 1–2 | 3DEP 1 m lidar (Pro, US) for survey-grade lines; free data shows the shape |
| Small farm or acreage, 0.1–2 km² | Rolling | 20–100 m | 0.5–2 | 2–10 | 3DEP 1 m lidar (Pro, US) for survey-grade lines; free data shows the shape |
| Farm, ranch or park, 2–10 km² | Hilly | 100–300 m | 2–10 | 10–20 | 3DEP 1 m lidar (Pro, US) for survey-grade lines; free data shows the shape |
| Town or valley, 10–50 km² | Hills to foothills | 300–800 m | 10–20 | 20–80 | Free data in the US; elsewhere use 20 m or more |
| Mountain area, 50–100 km² (free limit) | Mountains | 800–2,000 m | 20–50 | 80–200 | Free data, worldwide |
| Range or region, 100–2,000 km² (Pro) | High mountains | 1,500–4,000 m | 50–100 | 100–500 | Free data, worldwide |
Relief is the highest minus the lowest elevation in your selection (the tool shows both under Map data). Interval = relief ÷ 50, rounded up to 0.5, 1, 2, 5, 10, 20, 25, 50, 100 or 200 m (1, 2, 5, 10, 20, 40, 50, 80, 100, 200, 250 or 500 ft). The last column applies the 1947 National Map Accuracy Standard, interval ≥ 3.29 × the data's vertical RMSE: about 0.3 m for lidar, 5.1 m for the US 10 m data and 18 m for SRTM.
Index lines and labels
Index contours make a dense map readable. By convention every fifth line is bold and carries its elevation, so you can count the thin lines between labels instead of reading every one. The tool counts index lines from zero, so with a 10 m interval they fall on 50, 100, 150 m. Two settings matter:
- Index line every: 5 for intervals of 1, 2, 10 or 20; 4 for intervals of 25 (index lines on round hundreds); 0 turns them off for a uniform poster texture.
- Label index lines: places elevation labels along the bold lines, skipping spots where they would collide. Labels use the unit you chose.
In the exports, index lines keep their role: the GeoJSON and the Pro KMZ carry an index attribute, the DXF puts them on orange layers and the layered SVG draws them at double width with labels in their own group.
From contour spacing to slope
Slope is rise over run. Between two neighboring contours the rise is the interval and the run is the horizontal distance between them, so slope % = 100 × interval ÷ spacing and slope in degrees = arctan(interval ÷ spacing). Measure the spacing at right angles to the lines; the scale bar under the map converts screen distance to meters.
| Spacing on the ground | 1 m interval | 2 m interval | 5 m interval | 10 m interval | 20 m interval |
|---|---|---|---|---|---|
| 10 m (33 ft) | 10% | 20% | 50% | 100% | 200% |
| 20 m (66 ft) | 5% | 10% | 25% | 50% | 100% |
| 50 m (164 ft) | 2% | 4% | 10% | 20% | 40% |
| 100 m (328 ft) | 1% | 2% | 5% | 10% | 20% |
| 200 m (656 ft) | 0.5% | 1% | 2.5% | 5% | 10% |
| 500 m (1640 ft) | 0.2% | 0.4% | 1% | 2% | 4% |
Percent and degrees are easy to mix up. A 100% slope is 45°, not vertical, and a 10% road grade is under 6°.
| Slope | 2% | 5% | 10% | 15% | 25% | 50% | 100% |
|---|---|---|---|---|---|---|---|
| Degrees | 1.1° | 2.9° | 5.7° | 8.5° | 14.0° | 26.6° | 45.0° |
What slopes mean for building, drainage and farm machinery is covered in the land contour map guide.
Meters and feet
One international foot is exactly 0.3048 m. Choosing feet in the tool computes levels at round foot values, so a 10 ft interval puts lines at 3.048 m steps rather than relabeling 3 m lines. One meter is 3.28 ft, so a 2 m interval is about 6.6 ft, 10 m about 33 ft and 20 m about 66 ft. None of these is a round number of feet, which is why plans in feet use 1, 2, 5, 10, 20 or 40 ft instead. USGS 1:24,000 quadrangles mostly use 10, 20 or 40 ft. For CAD the DXF can also be written in US survey feet, the unit of many State Plane drawings, which differs from the international foot by 2 parts per million.
Frequently asked questions
What is an elevation contour map?
It is a map of lines that each join points of the same height above sea level. The vertical step between neighboring lines is the contour interval. Lines close together mean steep ground; lines far apart mean flat ground.
What contour interval should I use?
Divide the relief of your area (highest minus lowest point) by about 50 and round up to a conventional value: 1, 2, 5, 10, 20, 25, 50 or 100 m. The Boulder demo spans 497 m, so 10 m gives 50 levels. Then check the data can carry it: below about 5 m in the US or 18 m elsewhere, the free data shows the shape of the land but not survey-grade heights.
What are index contours?
Index contours are every fifth line, drawn bold and labeled with the elevation. With a 10 m interval they fall at 50 m steps. With a 25 m or 25 ft interval, set Index line every to 4 so the bold lines fall on round hundreds.
How do I work out slope from a contour map?
Measure the horizontal distance between two neighboring contours and divide the interval by it. Contours 10 m apart on a 2 m interval mean 2 ÷ 10 = 20%. The tool also reports the mean slope of your whole area under Map data.
Meters or feet?
Use the unit of the plans or maps you will compare with. US topographic maps and most US site plans use feet; the rest of the world uses meters. Switching the unit in the tool recomputes the levels, it does not just relabel them, so a 5 ft interval gives lines at 5 ft steps.
Is an elevation map generator the same as a contour map maker?
Often, yes. An elevation map generator may produce colored shading instead of lines; this one draws contour lines and can add elevation tints between them, so you get both the measured lines and the color reading of height.